Drawing level curves of z=(x²+y²)/y in Maple

Join the discussion
Registration is free. Ask a follow-up in this thread, or start your own.
3 replies · 2K views
Yankel
Messages
390
Reaction score
0
Hello all,

I am trying to draw the level curves of this function:

\[z=\frac{x^{2}+y^{2}}{y}\]

at C=-1,-2,1,2

I started with C=1, and I got kind of stuck with this shape

\[x^{2}+y^{2}=y\]

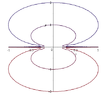
Maple gave this as the answer, I don't get it:

View attachment 1879

thanks !
 

Attachments

  • Capture.PNG
    Capture.PNG
    7 KB · Views: 139
Physics news on Phys.org
Maple is definitely not giving you a good picture. These level curves are all of them circles. Different $z$ values have the effect of raising and lowering the circles. I'm not terribly familiar with Maple, but plotting these functions is often a matter of using some sort of implicit plot, since your function is defined implicitly. Sage gave me circles as a plot, which confirms what I think they ought to be. Check Maple's documentation and see if there isn't a specific command for plotting implicit functions.

\begin{align*}
zy&=x^{2}+y^{2} \\
0&=x^{2}+y^{2}-zy \\
\frac{z^{2}}{4} &=x^{2}+y^{2}-zy+ \frac{z^{2}}{4} \\
\frac{z^{2}}{4} &= x^{2}+ \left( y- \frac{z}{2} \right)^{ \! 2}.
\end{align*}
This is the equation of a circle centered at $(0,z/2)$ of radius $z/2$.
 
Don't expect Google to do your thinking for you! Your picture looks funny for two reasons: 1) The curves are not closing on the x-axis and, 2) your x and y-axes have different scales: the distance from 0 to 1 on the x-axis is larger than the distance from 0 to 1 on the y-axis so the circles look like ellipses. In any case, whoever gave you this problem expects you to be able to complete the square as Ackbach did.
 
Almost ever the use of polar coordinates conducts to a more simple solution... in this case we obtain... $\displaystyle \frac{x^{2} + y^{2}}{y} = a \implies r = a\ \sin \theta\ (1)$

... where $\theta$ must produce a value of $r \ge 0$...

Kind regards $\chi$ $\sigma$