Finding the center frequency and bandwidth of a Pass-band filter

Join the discussion
Registration is free. Start your own thread to ask a follow-up.
7 replies · 6K views
paulmdrdo
Messages
89
Reaction score
2
Homework Statement
See attached photo
Relevant Equations
See attached photo
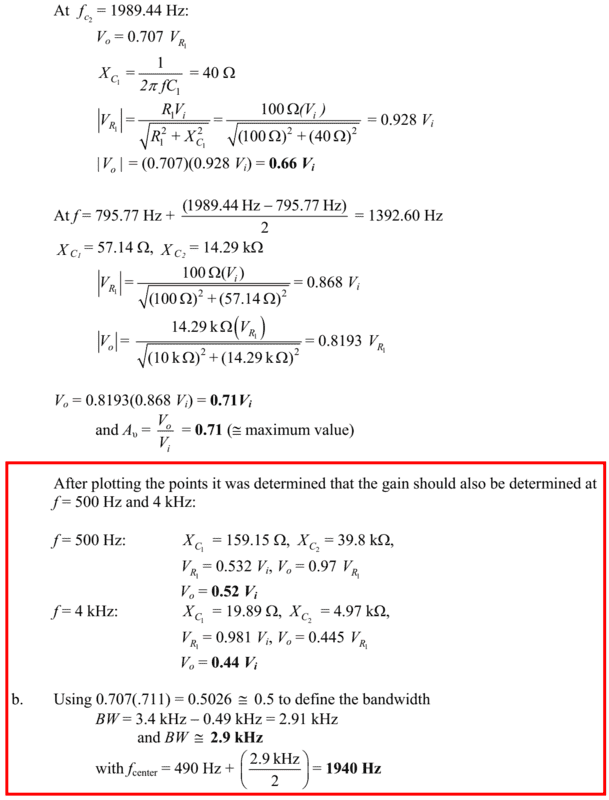
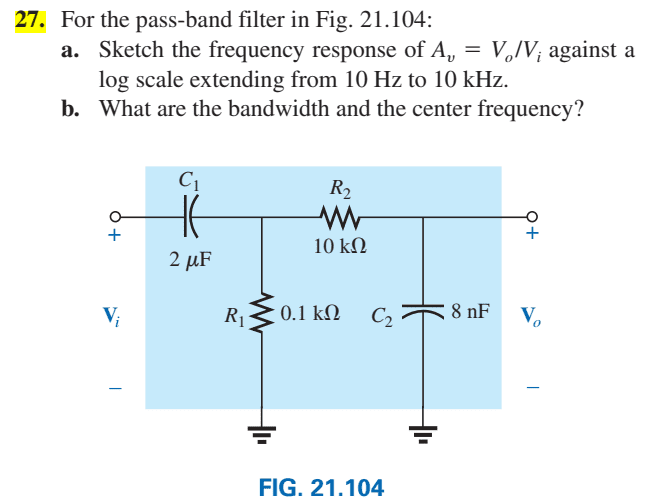
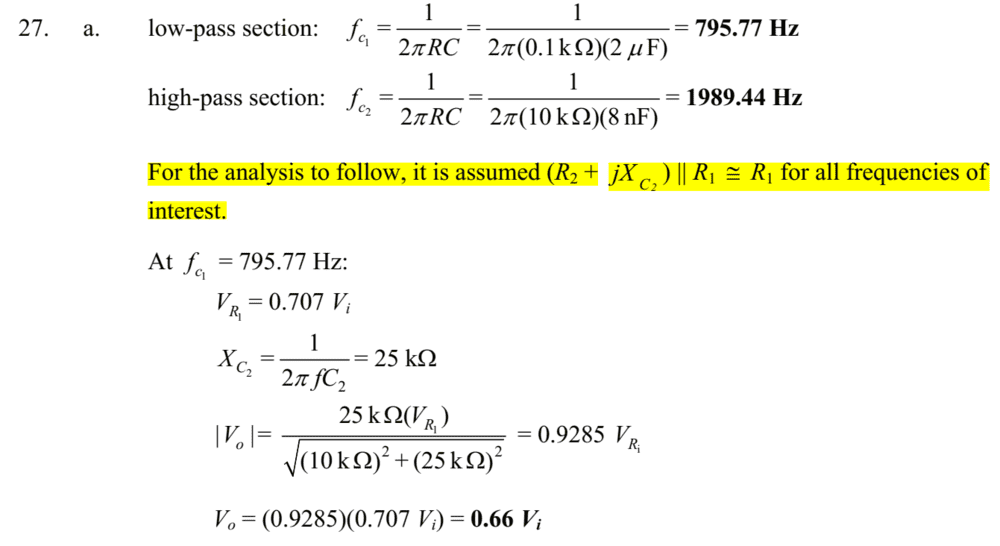
I tried solving this problem and got it correctly until the part A of the question.

My solution is the same as the one given in the solutions manual until the part I put in the red box.
I don't understand what is the logic behind the calculation of the bandwidth and center frequency there.
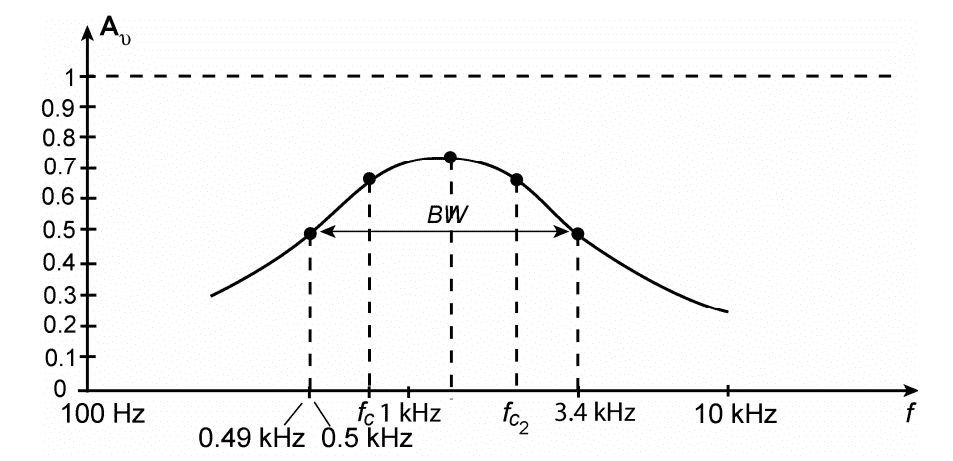
Where did the 3.4 Khz and 0.49Khz comes from. Please help me understand this process.
Thank you!
1565929476043.png
1565929594312.png

1565929660447.png

1565929689141.png
 
Physics news on Phys.org
It looks like they have defined the bandwidth to be frequencies where the response amplitude is greater 0.707x the peak amplitude response, which in this case is an amplitude response greater than 0.5. Then the center frequency is midway between the frequencies where the response amplitude is 0.5.
Note, I didn't verify any of the calculations (too lazy, LOL). Also, I would have done it a bit differently then their method.
 
To me, it is not quite clear what your question is.
More than that, who has performed the "calculation" starting with 27 a ??

To me, the whole process looks wrong.

You cannot divide the analysis into two parts: Lowpass and highpass section.
This is allowed only if both sections are decoupled which is not the case...

The best and most correct way is to find the overall bandpass transfer function as a result of a very simple calculation. From this transfer function you immediately can derive the midfrequency as well as the gain and the bandwidth.
 
Last edited:
  • Like
Likes   Reactions: DaveE
LvW said:
You cannot divide the analysis into two parts: Lowpass and highpass section.
This is allowed only if both sections are decoupled which is not the case...
I contend that the two sections are decoupled. Note that the output impedance of the first stage is <100Ω, and the input to the second stage is more than 100 times larger. Less than 1% loading generally qualifies as irrelevant.

(After all, how many 1/2% capacitors do you find in the wild?)
 
Last edited:
LvW said:
To me, it is not quite clear what your question is.
More than that, who has performed the "calculation" starting with 27 a ??

To me, the whole process looks wrong.

You cannot divide the analysis into two parts: Lowpass and highpass section.
This is allowed only if both sections are decoupled which is not the case...

The best and most correct way is to find the overall bandpass transfer function as a result of a very simple calculation. From this transfer function you immediately can derive the midfrequency as well as the gain and the bandwidth.
Yes! That's the alternate method I obliquely referred to. With only 4 elements, it's not hard to find the transfer function.

For a relatively low Q filter, you should be able to separate the HPF and LPF response as a reasonable approximation. Certainly if Q < 0.1 or so, when the roots are real and well separated.
Based on these answers, Q ≈ 0.4, so the approximation isn't great.

This is a nice reference for this :
http://eas.uccs.edu/~cwang/ECE5955_F2015/PowerElectronics_f2015/ch8/Sect8-1-7.pdf
Plus the adjacent sections.
 
Tom.G said:
I contend that the two sections are decoupled. Note that the output impedance of the first stage is <100Ω, and the input to the second stage is more than 100 times larger. Less than 1% loading generally qualifies as irrelevant.
(After all, how many 1/2% capacitors do you find in the wild?)

Tom.G - here are the correct results. Do you still think that "loading qualifies as irrelevant" ?

fc1=483.33 Hz (3dB-corner)
fc2=3276.3 Hz (3db corner)
Bandwidth B=2793 Hz
Fo=1258 Hz.

Explanation for loading effects: The phase of frequency-dependent networks is much more sensible to simplifications and tolerances than the magnitudes.
 
paulmdrdo said:
I tried solving this problem and got it correctly until the part A of the question.

My solution is the same as the one given in the solutions manual until the part I put in the red box.
I don't understand what is the logic behind the calculation of the bandwidth and center frequency there.
Where did the 3.4 Khz and 0.49Khz comes from. Please help me understand this process.
Thank you!

I think the 3.4 kHz and 0.49 kHz were determined by looking at a crude hand made sketch of the frequency response.

Here are accurate plots of the responses of the two possibilities. The response of the coupled transfer function is shown in blue, and the uncoupled TF is shown in red. The first plot goes from 10 Hz to 10 kHz, as the problem required, rather than from 100 Hz to 10 kHz.

From these plots a better determination of the two cutoff frequencies (where the response is .5) can be made because I've made the plots with a mathematical software rather than just sketching a few points by hand and connecting the dots. I've shown grid lines at the frequencies calculated by LvW.

Two BP.png
 
paulmdrdo said:
I don't understand what is the logic behind the calculation of the bandwidth and center frequency there.
Where did the 3.4 Khz and 0.49Khz comes from. Please help me understand this process.

Here is the bandpass transfer function:

H(s)=sT1/[1+s(T1+T2+R1C2)+s²T1T2] with T1=R1C1 and T2=R2C2

If we compare this function with the general second-order function we can derive:

wo=1/sqrt(T1T2) and
Q=1/[wo(T1+T2+R1C2)] and
B=wo/Q


Inserting the given values we get the figures as given in my former post.