For OmCheeto (astrospectroscopy)

  • Level: High School 
  • Thread starter Andy Resnick
  • Start date
7 replies · 2K views · last reply
Science Advisor
Education Advisor
Insights Author
Messages
7,852
Reaction score
4,227
Tried to do some astrospectroscopy last night (fail), but figured I'd share the results anyway.

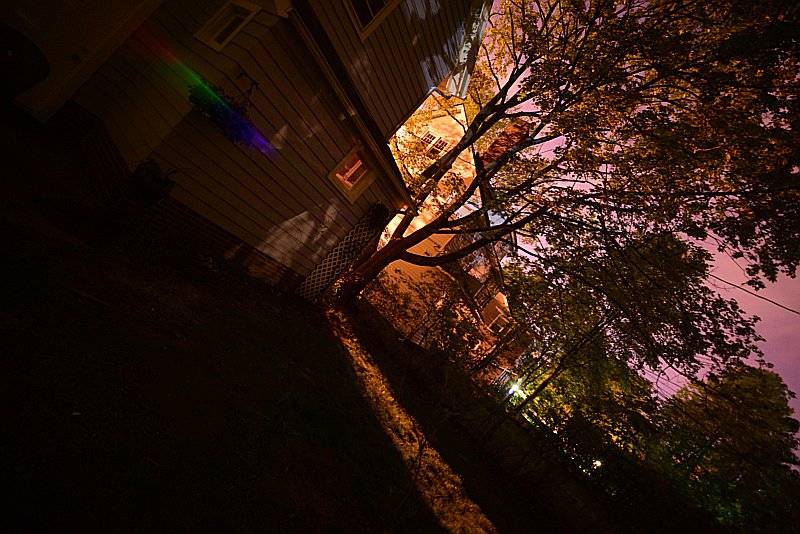
I taped a diffraction grating onto the lens flange (lens side, not camera side) to image some spectra- I was hoping to compare Jupiter, Spica, and Arcturus. For whatever reason, my old Sony worked much better for this- I think that Sony puts their sensor much closer to the lens flange than Nikon so the spectra still fall onto the chip. I ended up having to use a wide-angle lens to capture the spectrum, the trade-off being much less throughput. Images from my backyard- one of a streetlight (with Jupiter and Spica visible), and the other a neighbor's back porch light. These are 6s ISO 1000 exposures:
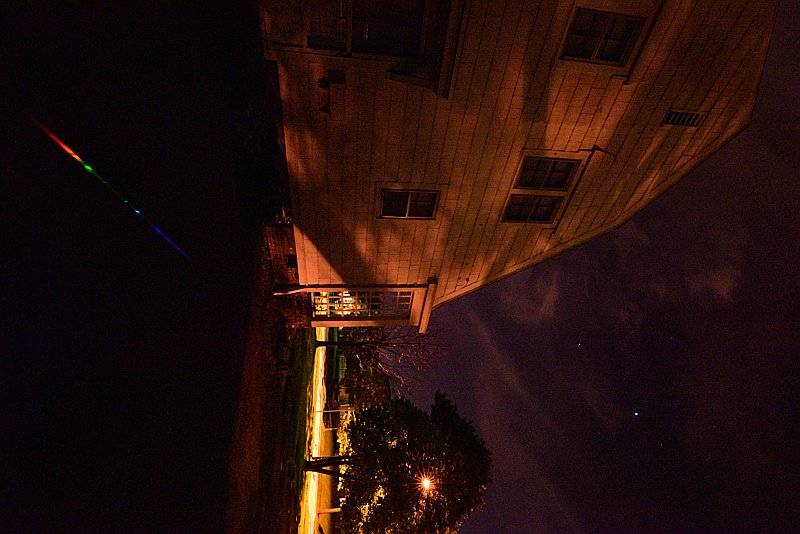
Night photo of a two-storey house with a lit porch and a streetlight-lit tree; a faint rainbow-coloured diffraction streak runs across the upper left dark sky.


Dim night photo of a backyard with a tree and a two-storey house with a lit window, rotated sideways, with a faint rainbow streak from a diffraction grating at upper left.


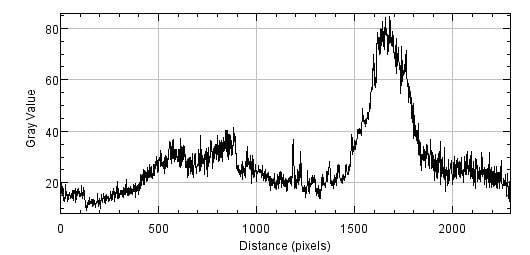
Unfortunately, the planet/starlight was just too faint for me to capture. The lights, however, have measurably different spectra (first one is the streetlight, most likely a Sodium lamp), the second an LED. Note also, the horizontal axis goes from red to blue and you can clearly see the Sodium lamp spectral peaks:
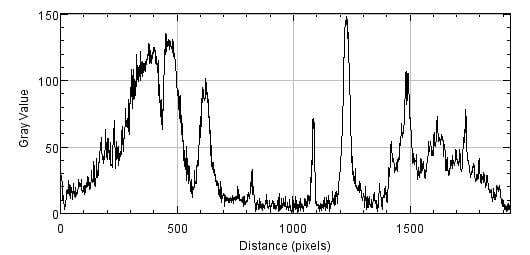
Line graph of gray value against distance in pixels, showing a spectrum with a broad hump near 400 pixels and sharp peaks near 470, 620, 1100, 1220, 1480 and 1700 pixels.


Line graph of gray value against distance in pixels, from 0 to about 2300, showing a broad hump near 600 and a tall narrow peak near 1650 that reaches about 80.


(for comparison: https://image.slidesharecdn.com/201...-all-you-need-to-know-7-638.jpg?cb=1358421058)
 
  • Like
Likes   Reactions: DennisN, OmCheeto, BvU and 1 other person
A guy at my local Astro Society gave a talk about Spectroscopy and he had some great pictures and graphs of spectra he'd obtained with a diffraction grating, using a section of the digital colour i mage. You could distinctly see the overall curve which corresponded to the temperature of the chosen star and also some absorption lines. All from a humble back yard!
Andy Resnick said:
I think that Sony puts their sensor much closer to the lens flange than Nikon so the spectra still fall onto the chip.
We didn't discuss the optical arrangement but I sort of assumed he was using prime focus and just put the grating 'somewhere' up the tube and it all came out right. (I should have known better. Nothing just comes out right with Astrophotography.
 
  • Like
Likes   Reactions: Andy Resnick
I carved my diffraction grating to fit my lens.

Photo of a Fujifilm SLR camera with a diffraction grating filter mounted on the lens, showing a rainbow spectrum with wavelength labels 500 and 550 along the bottom.


I'm also a big fan of "night lights" spectroscopy:

Night photo through a diffraction grating showing dispersed spectra of lights: a porch light labelled CFL, a street light labelled LED, and a street light at the top labelled street light, with the timestamp 2017.01.09 03:06 am.


hmmmm...
Was this thread inspired by the Pamela Gay interview from yesterday?
By the end of it, I had half a dozen new tabs on my browser open.
 
  • Like
Likes   Reactions: DennisN
OmCheeto said:
<snip>
Was this thread inspired by the Pamela Gay interview from yesterday?

Nope- I was photographing the Markarian Chain and clouds started to move in, so I grabbed the opportunity to goof around.
 
  • Like
Likes   Reactions: OmCheeto
Andy Resnick said:
Nope- I was photographing the Markarian Chain and clouds started to move in, so I grabbed the opportunity to goof around.
The last thing she mentioned was the upcoming eclipse.
That prompted me to check out the society she mentioned that she belongs to; "...I’m the Director of Technology and Citizen Science at the Astronomical Society of the Pacific."
There I found that they had the RSpec Explorer Spectrometer for sale. Only $440.
I thought that would be cool to own, but the price was a bit too much, so I'll probably stick with my $1.25 diffraction grating.
The RSpec Spectrometer also doesn't appear to have the range I'm looking for:
Spectral range is approximately 390 to 700 nanometers. Accuracy is generally 1% or better. Spectroscopic features as narrow as 3 nanometers can be measured.​
That looks suspiciously like the visual range. If I'm going to spend more than $100 on something, it had better also measure IR & UV.
Perhaps 200 to 1500 nanometers.
I'm not really sure. Some day I'll research that.
(google google google)

Ok. After I win the lottery.
Low Cost GREEN-Wave Spectrometer
350-1150nm wavelength range
$1,948.00​
 
  • Like
Likes   Reactions: sophiecentaur
OmCheeto said:
There I found that they had the RSpec Explorer Spectrometer for sale. Only $440.
I thought that would be cool to own, but the price was a bit too much, so I'll probably stick with my $1.25 diffraction grating.`

Yeah, I'm with you- we hand out those cheap gratings to students (we buy in bulk, I think they end up about $0.50 each) and let them look at spectra themselves- why involve a computer?

Just decided to get a big sheet/roll of grating (like https://www.onlinesciencemall.com/p...=27348598342&gclid=CLOsw_nn-dMCFY-BaQod4x0CuA) to put over the front element of my telephoto. Not sure it will work, but I can afford the $6.50 to try. Science!
 
  • Like
Likes   Reactions: OmCheeto
Success!

As per the image in post #4, I put a grating sheet in front of the lens and was easily able to get spectra of Jupiter, Spica, and Arcturus. The spectra are about 10 degrees off normal, so it took me a bit to realize that I can't look at the object itself in order to capture the spectra. By happenstance, the spectra of Jupiter and Spica appear together- Jupiter is off the frame to the upper right, Spica is off to the left to the lower left:
Diffraction spectrum of a star on a dark brown sky, a long streak with red, green and blue bands running from upper right to lower left and a second streak crossing near the top


Here's Arcturus:
Long diagonal rainbow-coloured spectrum on a dark red-tinted night sky, running from violet at lower left through blue, green and yellow to red at upper right, with a few faint star points above it.


Now, using this to make quantitative measurements is tricky: Bayer filter, etc. Here are RGB lineplots through the spectra of Jupiter, Spica, and Arcturus:

Line plot of Value against Distance with three coloured curves: blue peaks near 1,000, green near 2,000 and red near 2,800, with Value on the vertical axis up to about 200.


Line plot of Value against Distance from 0 to 4000 showing noisy red, green and blue intensity profiles; the blue curve has a sharp narrow spike near distance 700 reaching about 250.


Line plot of Value against Distance with three noisy traces: blue peaks near 800-1000, red stays near 40-50, green rises gradually to about 30 near 2000 and then falls back.


You can see where Jupiter's spectrum overlapped Spica's (the narrow peak). It's not immediately obvious how these correspond to the different colors, but if I plot the spectral intensity ('brightness') rather than the actual colors in the same order, the difference is more clear:

Line graph of gray value against distance in pixels, rising to a peak near 1000 pixels, dipping near 1600, peaking again near 2700, then falling to low values by 4000 pixels.


Line graph of gray value against distance in pixels, from 0 to about 4800, showing a noisy curve that rises to a broad peak near 1300 pixels, falls toward 40 by 4000 pixels, and has a sharp narrow spike near 700 pixels.


Line plot of gray value against distance in pixels, rising from about 25 to a broad peak near 100-110 around 1000-1500 pixels, dipping to about 60 near 2500 pixels, then jumping to a sharp peak near 110 at about 2700 pixels and declining to about 30 by 4300 pixels.


Now, Spica's curve shows how predominantly blue it is, while Arcturus emphasizes the red end. Not sure why there is a 'notch' in the yellow band...
 
  • Like
Likes   Reactions: OmCheeto and sophiecentaur