From Nyquist plot to real conductivity spectra (sigma)

Join the discussion
Ask a follow-up here, or get your own question answered by working scientists, mathematicians and engineers — people, not an autocomplete.
Real named experts · corrections over time · the nuance an AI answer skips
3 replies · 2K views
Olha
Messages
2
Reaction score
0
TL;DR
From Nyquist plot to real conductivity spectra (sigma) vs frequency
Hi, I have data of impedance but due to limitation of software after measurement I do not receive numerical values for admittance and real conductivity vs frequency. How mathematically I can convert Nyquist plot into plot real conductivity vs frequency?
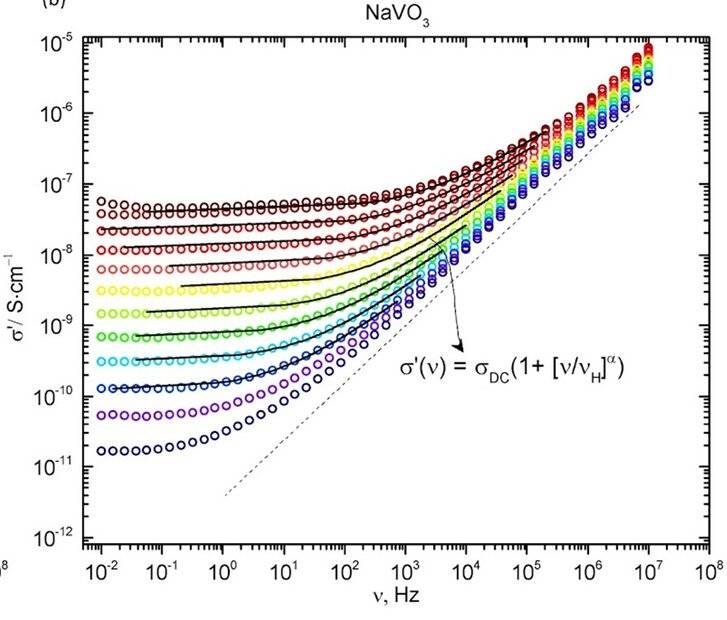
conductivity spectra.jpg
 
Physics news on Phys.org
Your plot already shows the real part of the complex conductivity. Do you need the imaginary part?
 
Reply
  • Like
Likes   Reactions: Lord Jestocost
The image is the result I want to get. For now I have Nyquist plot Im vs Re, which I would like to transform it to the plot you see attached, real part of complex conductivity vs frequency. I have done it trough admittance but I am not sure in all formulas I used for it...
 
Please, show us your method.
 
Reply
  • Like
Likes   Reactions: SammyS