Graphs of s, v and a for a mass with a piece of paper attached

Click For Summary
SUMMARY

The discussion focuses on the dynamics of a mass with a piece of paper attached, exploring the relationship between position, velocity, and acceleration in the context of damped harmonic motion. Participants clarify that velocity is the derivative of position, while acceleration is the derivative of velocity. The significance of the attached paper is debated, with suggestions that it introduces damping to the system. Tools such as GeoGebra and PhET simulations are recommended for visualizing the graphs of displacement, velocity, and acceleration over a time period of 2T.

PREREQUISITES
  • Understanding of simple harmonic motion (SHM)
  • Knowledge of derivatives in calculus
  • Familiarity with damping in oscillatory systems
  • Experience using graphing tools like GeoGebra
NEXT STEPS
  • Explore the concept of damping in harmonic oscillators
  • Learn to use GeoGebra for graphing motion equations
  • Study the effects of air resistance on oscillatory motion
  • Investigate the mathematical modeling of net forces in oscillatory systems
USEFUL FOR

Students and educators in physics, particularly those studying mechanics and oscillatory motion, as well as anyone interested in visualizing and modeling dynamic systems.

AN630078
Messages
242
Reaction score
25
Homework Statement
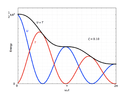
Hello, I am really struggling to sketch the following graphs to show how a mass with a piece of paper attached to it varies with time, over a time period of 2T, for: 1. Energy 2. Displacement 3. Velocity 4. Acceleration
Relevant Equations
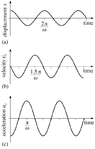
x=Acosωt v=-ωAsinωt a=-ω^2Acosωt
I understand that velocity is defined as the rate of change of position or the rate of displacement; and that acceleration is defined as the rate of change of velocity (it is the derivative of velocity).
Morever, I believe I know that for SHM these graphs vary sinusoidally (I have attached a picture of how I think these should appear).
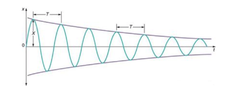
However, for a mass with a piece of paper attached could these graphs be represented by a harmonic oscillator with a small amount of damping? I really do not know where to begin in drawing these, I am very confused.
 

Attachments

  • Screenshot 2021-04-13 at 19.40.02.png
    Screenshot 2021-04-13 at 19.40.02.png
    15.6 KB · Views: 144
Physics news on Phys.org
It's not clear what is the significance of the piece of paper! Is this a translation?
 
PeroK said:
It's not clear what is the significance of the piece of paper! Is this a translation?
I have no idea, I really am very confused. The question just states " Sketch the following graphs to show how a mass with a piece of paper attached to it varies with time, over a time period of 2T"
 
So, the net force is no longer a constant...
you need to model the new net force... a constant plus a new contribution.

If it were damped, what would a sketch of the position-vs-time graph look like?
From that get the other two
[velocity-vs-time is a graph of the slopes of the position-vs-time graph,
acceleration-vs-time is a graph of the slopes of the velocity-vs-time graph
https://phet.colorado.edu/en/simulation/legacy/calculus-grapher [uses Flash]
Not quite as arbitrary as above (but more constructive]:
https://www.geogebra.org/m/dzxdbzAR
https://www.geogebra.org/m/ezKv36tC
]
Or one could work from the acceleration-vs-time [since you know the net force], then get the other two.

Possibly helpful.
https://www.wired.com/2017/04/lets-study-air-resistance-coffee-filters/
 
robphy said:
So, the net force is no longer a constant...
you need to model the new net force... a constant plus a new contribution.

If it were damped, what would a sketch of the position-vs-time graph look like?
From that get the other two
[velocity-vs-time is a graph of the slopes of the position-vs-time graph,
acceleration-vs-time is a graph of the slopes of the velocity-vs-time graph
https://phet.colorado.edu/en/simulation/legacy/calculus-grapher [uses Flash]
Not quite as arbitrary as above (but more constructive]:
https://www.geogebra.org/m/dzxdbzAR
https://www.geogebra.org/m/ezKv36tC
]
Or one could work from the acceleration-vs-time [since you know the net force], then get the other two.

Possibly helpful.
https://www.wired.com/2017/04/lets-study-air-resistance-coffee-filters/
Thank you for your reply. I have attached what I think the displacement tie graph for a draped oscillator would look like. However, I am uncertain how to find the v-t and a-t graphs from this? Would this be correct anyhow for the s-t graph?
 

Attachments

  • Screenshot 2021-04-13 at 21.52.11.png
    Screenshot 2021-04-13 at 21.52.11.png
    34.6 KB · Views: 149
And would the energy-time graph for a damped oscillator be as shown in the attachment ?
 

Attachments

  • Screenshot 2021-04-13 at 21.55.52.png
    Screenshot 2021-04-13 at 21.55.52.png
    44.1 KB · Views: 140
The book claims the answer is that all the magnitudes are the same because "the gravitational force on the penguin is the same". I'm having trouble understanding this. I thought the buoyant force was equal to the weight of the fluid displaced. Weight depends on mass which depends on density. Therefore, due to the differing densities the buoyant force will be different in each case? Is this incorrect?

Similar threads

  • · Replies 25 ·
Replies
25
Views
1K
  • · Replies 9 ·
Replies
9
Views
3K
  • · Replies 30 ·
2
Replies
30
Views
4K
  • · Replies 3 ·
Replies
3
Views
2K
Replies
2
Views
1K
  • · Replies 3 ·
Replies
3
Views
2K
Replies
17
Views
2K
  • · Replies 1 ·
Replies
1
Views
3K
  • · Replies 2 ·
Replies
2
Views
10K
Replies
1
Views
1K