Help with Bode plot simulation using Simetrix

Click For Summary

Discussion Overview

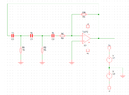
The discussion revolves around simulating a circuit to generate a Bode plot using Simetrix, focusing on the analysis of an op-amp's behavior in both ideal and real conditions. Participants explore the implications of loop gain and phase shift on oscillation frequencies, as well as the challenges of incorporating unwanted capacitances in the TL072 op-amp.

Discussion Character

  • Exploratory
  • Technical explanation
  • Debate/contested
  • Mathematical reasoning

Main Points Raised

  • Some participants suggest starting the simulation without closing the loop to obtain the Bode plot of the transfer function first.
  • One participant notes that the Bode plot provided in the problem appears to represent the open-loop gain of a unity-gain stable op-amp rather than the required plot.
  • Another participant mentions calculating an oscillation frequency of about 65kHz and expresses a desire to compare ideal and real op-amps.
  • Several participants emphasize the importance of verifying the Barkhausen condition for oscillation, requiring loop gain to be somewhat larger than unity with zero phase shift at the desired frequency.
  • There are discussions about the accuracy of the phase shift shown in the manufacturer's data sheet for the TL072 op-amp, with some participants arguing that it is not precise enough for calculations.
  • One participant expresses uncertainty about the simulation settings and the clarity of the results obtained from their recreated circuits and Bode plots.

Areas of Agreement / Disagreement

Participants express multiple competing views regarding the accuracy of the phase shift data from the TL072 op-amp's data sheet and the implications for the simulation results. The discussion remains unresolved with respect to the exact values and conditions necessary for accurate predictions of oscillation behavior.

Contextual Notes

Limitations include potential inaccuracies in the simulation settings and the need for clearer definitions of variables shown in circuit diagrams. There is also a noted dependency on the specific op-amp model used and its associated characteristics.

Callum Plunkett
Messages
27
Reaction score
8
Homework Statement
I have been given an assignment relating to RC phase shift oscillators. For me to confirm my findings I require a bode plot read out. However, after many attempts, countless videos and reading material I am still unable to achieve anything. Can some kind person point me in the right direction?.
Relevant Equations
Drawings attached.
1642530910058.png

1642530991472.png

1642531041362.png
 

Attachments

  • 1642530649865.png
    1642530649865.png
    13.8 KB · Views: 176
  • 1642530667852.png
    1642530667852.png
    12.1 KB · Views: 154
  • 1642530683268.png
    1642530683268.png
    30.5 KB · Views: 220
Physics news on Phys.org
I would start by simulating the circuit without closing the loop directly from the output to the input. Get the Bode Plot of the transfer function with a signal source driving the input first, then you can close the loop and run a transient plot to see if it starts up and oscillates. What are you looking for on the initial Bode plot to predict where the oscillation frequency should be? :smile:
 
  • Like
Likes   Reactions: Callum Plunkett
BTW, the Bode plot that is included in the problem appears to be the open-loop gain of a unity-gain stable opamp by itself. It's definitely not the Body plot they are asking you to find...
 
  • Like
Likes   Reactions: Callum Plunkett
berkeman said:
I would start by simulating the circuit without closing the loop directly from the output to the input. Get the Bode Plot of the transfer function with a signal source driving the input first, then you can close the loop and run a transient plot to see if it starts up and oscillates. What are you looking for on the initial Bode plot to predict where the oscillation frequency should be? :smile:
Thanks for the reply! I’ve calculated the frequency of oscillation of about 65kHz. I was hoping to graph both an ideal op-amp and a TH072 op-amp and compare them. Another issue I’m having is with the unwanted capacitances within the TL072 and how to determine the value of them. Unfortunately, op-amps are not something I deal with day to day so I am struggling a lot with this particular subject.
 
* At first, you should verify if the oscillation condition (Barkhausen) is fulfilled: Loop gain (somewhat larger than) unity with zero phase shift at the desired frequency fo.
* For this purpose, the loop gain (gain of the complete open loop) has to be analyzed (ac analysis, magnitude and phase) . You should open the loop at the node left to C3 for injecting an ac test signal.
* This analysis should be made for the ideal as well as real opamp model. You will notice a remarkable difference - caused by the unwanted (but unavoidable) reduced open-loop gain Aol as well as phase shift introduced by the real opamp model (if it is a good and realistic model).
* For this purpose, you should not use the graph as contained in the data sheet (and reproduced in your contribution). The graph shows a parasitic phase shift (at 65kHz) of zero deg which is not correct (too rough). To verify the real contribution of the opamp model you should perform a separate ac anylysis of the opamps open-loop gain Aol and phase response .
 
Last edited:
  • Informative
  • Like
Likes   Reactions: Callum Plunkett and berkeman
LvW said:
* At first, you should verify if the oscillation condition (Barkhausen) is fulfilled: Loop gain (somewhat larger than) unity with zero phase shift at the desired frequency fo.
* For this purpose, the loop gain (gain of the complete open loop) has to be analyzed (ac analysis, magnitude and phase) . You should open the loop at the node left to C3 for injecting an ac test signal.
* This analysis should be made for the ideal as well as real opamp model. You will notice a remarkable difference - caused by the unwanted (but unavoidable) reduced open-loop gain Aol as well as phase shift introduced by the real opamp model (if it is a good and realistic model).
* For this purpose, you should not use the graph as contained in the data sheet (and reproduced in your contribution). The graph shows a parasitic phase shift (at 65kHz) of zero deg which is not correct (too rough). To verify the real contribution of the opamp model you should perform a separate ac anylysis of the opamps open-loop gain Aol and phase response .
Yeah I thought that 65kHz was abit off as I calculated the single stage phase angle as 68 degrees each for the RC ladder network, when I was hoping for something along the lines of 60 degrees. Thanks for the pointers, I am going to make an attempt tomorrow.
 
LvW said:
* For this purpose, you should not use the graph as contained in the data sheet (and reproduced in your contribution). The graph shows a parasitic phase shift (at 65kHz) of zero deg which is not correct (too rough).
That plot is on the manufacturer data sheet for the TL072 Op-Amp. It shows the phase shift as 90° at 65kHz.

Cheers,
Tom
 
Tom.G said:
That plot is on the manufacturer data sheet for the TL072 Op-Amp. It shows the phase shift as 90° at 65kHz.

Cheers,
Tom
Yes - I know.
However, as I have mentioned (and as you can see), this diagramm is not exact enough for calculating the real phase shift within the loop. The simulation model is much more exact.
 
Callum Plunkett said:
Yeah I thought that 65kHz was abit off as I calculated the single stage phase angle as 68 degrees each for the RC ladder network, when I was hoping for something along the lines of 60 degrees. Thanks for the pointers, I am going to make an attempt tomorrow.
It’s been a while (sick family member and so on..) but I’ve finally found some time to give this another go. I recreated both circuits and inserted a bode plot, to the left of C3 to gain the following graphs. I’m not 100% certain that I have all the settings for the simulation set correctly or in a manner that would make the results clearer or even correct. Hopefully I’m somewhere near.
1645450661070.png


1645450598547.png
 
  • #10
..."both circuits..." What is the difference?
Circuit diagrams and both graphs are hard to read.
Which variables are shown in the diagrams?
Loop gain?
What is your outcome?
 

Similar threads

  • · Replies 1 ·
Replies
1
Views
3K
  • · Replies 9 ·
Replies
9
Views
4K
  • · Replies 1 ·
Replies
1
Views
2K
  • · Replies 3 ·
Replies
3
Views
3K
  • · Replies 4 ·
Replies
4
Views
2K
Replies
9
Views
6K
  • · Replies 1 ·
Replies
1
Views
2K
Replies
16
Views
3K
  • · Replies 8 ·
Replies
8
Views
3K
  • · Replies 13 ·
Replies
13
Views
3K