mathmari
Gold Member
MHB
- 4,984
- 7
Hey! 
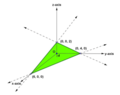
We have the basis $B=\left \{\begin{pmatrix}1 \\ 1 \\ 1\end{pmatrix},\begin{pmatrix}2 \\ 1 \\ 0\end{pmatrix}, \begin{pmatrix}1 \\ 2 \\ 1\end{pmatrix} \right \}$ of $\mathbb{R}^3$ and the vector $v$ can we written as a linear combination of the elements of the basis as follows:
\begin{equation*}v=\begin{pmatrix}2 \\ 8 \\ -1\end{pmatrix}=-\frac{17}{2}\begin{pmatrix}1 \\ 1\\ 1\end{pmatrix}+\frac{3}{2}\begin{pmatrix}2 \\ 1\\ 0\end{pmatrix}+\frac{15}{2}\begin{pmatrix}1 \\ 2\\ 1\end{pmatrix}\end{equation*}
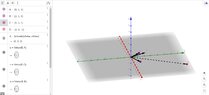
It is asked to visualize that in a coordinate system, by showing how the vector $v$ is generated by the basis.
For that do we draw the three vectors of the basis and the vector $v$ or do we have to draw also the multiples of the elements of the basis that we use at the linear combination? (Wondering)
I mean, is the following enough?
View attachment 8601
(Wondering)
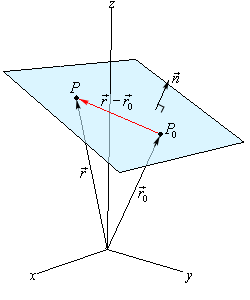
Further, we have the subspace $U=\left \{\begin{pmatrix}a \\ a+b \\ 2a-b\end{pmatrix}\middle| a, b\in \mathbb{R}\right \}$ of $\mathbb{R}^3$. How could we sketch $U$ in a coordinate system? (Wondering)
We have the basis $B=\left \{\begin{pmatrix}1 \\ 1 \\ 1\end{pmatrix},\begin{pmatrix}2 \\ 1 \\ 0\end{pmatrix}, \begin{pmatrix}1 \\ 2 \\ 1\end{pmatrix} \right \}$ of $\mathbb{R}^3$ and the vector $v$ can we written as a linear combination of the elements of the basis as follows:
\begin{equation*}v=\begin{pmatrix}2 \\ 8 \\ -1\end{pmatrix}=-\frac{17}{2}\begin{pmatrix}1 \\ 1\\ 1\end{pmatrix}+\frac{3}{2}\begin{pmatrix}2 \\ 1\\ 0\end{pmatrix}+\frac{15}{2}\begin{pmatrix}1 \\ 2\\ 1\end{pmatrix}\end{equation*}
It is asked to visualize that in a coordinate system, by showing how the vector $v$ is generated by the basis.
For that do we draw the three vectors of the basis and the vector $v$ or do we have to draw also the multiples of the elements of the basis that we use at the linear combination? (Wondering)
I mean, is the following enough?
View attachment 8601
(Wondering)
Further, we have the subspace $U=\left \{\begin{pmatrix}a \\ a+b \\ 2a-b\end{pmatrix}\middle| a, b\in \mathbb{R}\right \}$ of $\mathbb{R}^3$. How could we sketch $U$ in a coordinate system? (Wondering)