1plus1is10
- 51
- 0
Does anyone know a model to identify Straight Compact Linear data?
I've been toying with Pearson Correlation Coefficient and am very disappointed.
https://en.wikipedia.org/wiki/Pearson_correlation_coefficient
I originally thought that this would be exactly what I needed, but...
After some Googling, I soon discovered Anscombe's quartet.
https://en.wikipedia.org/wiki/Anscombe's_quartet
Frank Anscombe basically said "look at your data". Duh.
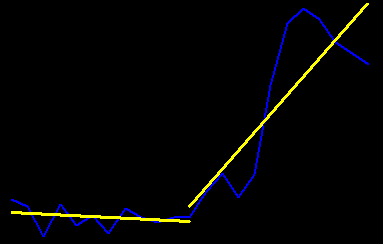
Per online calculator: https://www.socscistatistics.com/tests/pearson/Default2.aspx
The first line's PCC is: -0.2679=bad. The X values are 1-12 and the Y values are:
53
46
19
48
29
38
22
44
36
32
36
36
The second line's PCC is: 0.8358=good. The Y values are:
36
60
76
54
75
156
212
226
216
195
185
175
I need a model where the first line is good and the second is bad.
Any ideas?
I've been toying with Pearson Correlation Coefficient and am very disappointed.
https://en.wikipedia.org/wiki/Pearson_correlation_coefficient
I originally thought that this would be exactly what I needed, but...
After some Googling, I soon discovered Anscombe's quartet.
https://en.wikipedia.org/wiki/Anscombe's_quartet
Frank Anscombe basically said "look at your data". Duh.
Per online calculator: https://www.socscistatistics.com/tests/pearson/Default2.aspx
The first line's PCC is: -0.2679=bad. The X values are 1-12 and the Y values are:
53
46
19
48
29
38
22
44
36
32
36
36
The second line's PCC is: 0.8358=good. The Y values are:
36
60
76
54
75
156
212
226
216
195
185
175
I need a model where the first line is good and the second is bad.
Any ideas?
