Left-to-Right Wave — How Does Particle X Move?

  • Thread starter Thread starter Physical_Fire
  • Start date Start date
AI Thread Summary
The discussion revolves around understanding the motion of a particle, referred to as X, in relation to a left-to-right wave. Participants clarify that the particle's movement is influenced by the wave's peaks and troughs, indicating that X moves down when a peak is approaching and up when a trough is approaching. Mathematical representations are explored, particularly the derivative of the wave function, to analyze the particle's velocity and direction of movement. The conversation emphasizes the importance of visualizing the wave's motion over time to accurately determine the particle's behavior. Ultimately, the consensus highlights that the particle's movement is dictated by its position relative to the wave's features.
Physical_Fire
Messages
54
Reaction score
11
Homework Statement
Attached.
Relevant Equations
y= Sin(wt)
Hi,
I have an assignment on the waves chapter and have been stuck on a question. Initially, I drew I drew it as attached because 4 pi meant the same thing as the original graph but I have been marked incorrect for this question. How would one solve this?

Thanks

1743164970531.png


1743165439722.png
 
Last edited by a moderator:
Physics news on Phys.org
Try to relate your displacement of X with the motion of the wave. Is there anything wrong?
 
PeroK said:
Try to relate your displacement of X with the motion of the wave. Is there anything wrong?
Isn't the particle going up and then down?
 
Physical_Fire said:
Isn't the particle going up and then down?
Just after t=0, has the particle gone up or down? How can you tell?
 
Steve4Physics said:
Just after t=0, has the particle gone up or down? How can you tell?
Hasn't it gone up because the curve is upwards?
 
Draw the shape of the wave a small time (less than half a period) after the original time. Which direction has x moved?

More mathematically, any wave moving to the left will be described by a function ##u(x,t) = f(x-vt)##. The motion of the rope at ##x## is given by the partial derivative at ##x## wrt ##t##.what is this derivative?
 
Orodruin said:
Draw the shape of the wave a small time (less than half a period) after the original time. Which direction has x moved?

More mathematically, any wave moving to the left will be described by a function ##u(x,t) = f(x-vt)##. The motion of the rope at ##x## is given by the partial derivative at ##x## wrt ##t##.what is this derivative?
dy/dt (x,t) = -v * f'(x-vt)?
 
Physical_Fire said:
Hasn't it gone up because the curve is upwards?
That's just a guess. You should draw the graph of the wave after a short time and see where X has moved to. Always calculate.
 
PeroK said:
That's just a guess. You should draw the graph of the wave after a short time and see where X has moved to. Always calculate.
Like this? But it doesn't make sense. Why is the particle going down?

1743167778801.png
 
Last edited by a moderator:
  • #10
Physical_Fire said:
Like this? But it doesn't make sense. Why is the particle going down?
Because there is a trough approaching!
 
  • #11
Physical_Fire said:
Like this? But it doesn't make sense. Why is the particle going down?
Imagine putting some colours on the wave. Red for a trough/minimum, blue for zero (x-axis) and green for a peak/maximum. The point at X would start blue. The next change would be to red. You can imagine that red trough coming in from the left heading towards X. The green colour (peak) has already gone and is moving away from X to the right.

In that snapshot of the wave, X has has its peak and is on the way down!
 
  • #12
Yeah I understand that @PeroK. But how do I solve it mathematically dy/dt (x,t) = -v * f'(x-vt)? Since it's a sin graph, dy/dt (x,t) = -v * cos(x-4pi). But it doesn't give me the correct graph. Why and how do I get the correct graph mathematically?
 
  • #13
Physical_Fire said:
Yeah I understand that @PeroK. But how do I solve it mathematically dy/dt (x,t) = -v * f'(x-vt)? Since it's a sin graph, dy/dt (x,t) = -v * cos(x-4pi). But it doesn't give me the correct graph. Why and how do I get the correct graph mathematically?
We can only draw a graph of ##y## as a function of ##x## at some fixed time ##t = T##, say. The wave itself is a continuous succession of graphs with ##x## and ##y## axes. Also, we can show the motion of a given point at ##x = X## as time varies. That would be a graph with ##t## and ##y## axes.

The reality is that a point on the second graph (##y(X, t)##) is increasing at a time ##t## where a peak is to the left of point ##X## in the first graph. And, ##y(X, t)## is descreasing at a time ##t## when a peak is to the right of ##X## in the first graph.

In general, you are trying to amalgamate the ##x-y## graph with the ##t-y## graph.
 
  • #14
then how to sketch this graph?
 

Attachments

  • 1743178820155.png
    1743178820155.png
    14.5 KB · Views: 21
  • #15
Physical_Fire said:
dy/dt (x,t) = -v * f'(x-vt)?
Is this positive or negative if ##f’(x-vt)## is positive?
 
  • #16
Orodruin said:
Is this positive or negative if f′(x−vt) is positive?
It's negative
 
  • #17
Physical_Fire said:
It's negative
And what is the derivative with respect to x in your original image of the wave at the given position X? Positive or negative?
 
  • #18
Physical_Fire said:
then how to sketch this graph?
I'm not sure what you mean. That image is trying to convey several things. It's not just a graph.
 
  • #19
Orodruin said:
And what is the derivative with respect to x in your original image of the wave at the given position X? Positive or negative?
Is it positive?
 
  • #20
Physical_Fire said:
Is it positive?
So the velocity X is moving at is …
 
  • #21
Orodruin said:
So the velocity X is moving at is …
positive?
 
  • #22
Physical_Fire said:
Yeah I understand that @PeroK. But how do I solve it mathematically dy/dt (x,t) = -v * f'(x-vt)? Since it's a sin graph, dy/dt (x,t) = -v * cos(x-4pi). But it doesn't give me the correct graph. Why and how do I get the correct graph mathematically?
If we go back to this. We start with the wave equation:
$$y(x, t) = \sin(x - vt)$$This cannot be represented on a 2D graph. The best visualisation is an animation of a series of 2D graphs of ##y## against ##x## at each time ##t##. The first question is whether the wave is moving to the right or left? Let's assume that ##v## is positive.

First, we can see that at ##t = 0## we have:$$y(x, 0) = \sin(x)$$Now, what does the graph look like after some small time interval ##\Delta t##? Initially we have
$$y(0,0) = 0 \ \text{and} \ \ y(\frac \pi 2, 0) = 1$$At time ##\Delta t##, we have:
$$y(v\Delta t, \Delta t) = 0 \ \ \text{and} \ \ y(\frac \pi 2 + v\Delta t, \Delta t) = 1$$And we can see that the point on the wave where ##y = 0## has moved to the right by a distance ##v\Delta t## and the initial peak at ##x = \frac \pi 2## has also moved to right by the same distance. This is what we mean by the wave moving to the right with speed ##v##.

Technically, however, no points are moving to the right. Instead, each point on the wave is moving up and down. We can look at the points at ##x =0## and ##x = \frac \pi 2## and describe their motion over time. We have:
$$y(0, t) = \sin(-vt) \ \ \text{and} \ \ y(\frac \pi 2, t) = \sin(\frac \pi 2 - vt)$$And the motion of these points is:
$$\frac{dy}{dt}(0, t) = -v\cos(-vt) \ \ \text{and} \ \ \frac{dy}{dt}(\frac \pi 2, t) = -v\cos(\frac \pi 2 - vt)$$When we plot these motions on a graph, they have the same shape as the wave - the cosine is just the sine with a different phase. The important question here is the direction of motion of these points at time ##t = 0##:
$$\frac{dy}{dt}(0, 0) = -v \ \ \text{and} \ \ \frac{dy}{dt}(\frac \pi 2, 0) = 0$$And we can see that at time ##t =0## the point at the origin is moving down (at the maximum speed) and the point at ##x = \frac \pi 2## is instantaneously at rest. And, indeed, this point must move down immediately after ##t = 0##.

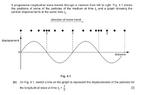
That's why if we draw a graph of the point X, which is a zero point on the wave to the left of a peak, it is initially moving down. Likewise, a zero point on the graph that is to the left of a trough will initially be moving up. In general, points behind a peak are moving down; and, points in front of a peak are moving up. This should make sense if you think of the wave coming through and lifting up points and dropping them back down again.

Another way to look at this is to consider a frame of reference in which the wave is at rest. I.e. a reference frame moving to the right at speed ##v##. In this frame, the points on the x-axis are moving to the left with speed ##v## and following the wave in the reverse direction, as it were. E.g. the point X is headed for a trough and must be initially moving down.
 
Last edited:
  • #23
Physical_Fire said:
positive?
Now you are contradicting yourself …

Orodruin said:
The motion of the rope at x is given by the partial derivative at x wrt t.what is this derivative?

Physical_Fire said:
dy/dt (x,t) = -v * f'(x-vt)?

Orodruin said:
Is this positive or negative if f′(x−vt) is positive?

Physical_Fire said:
It's negative

We have established velocity of x is negative if f’(x-vt) is positive.

Orodruin said:
And what is the derivative with respect to x in your original image of the wave at the given position X? Positive or negative?

Physical_Fire said:
Is it positive?

Yes, f’(x-vt) is positive.

Orodruin said:
So the velocity X is moving at is …

Physical_Fire said:
positive?

Why then do you pick positive here? 🤔
 
  • #24
I think I understand it now. Thanks everyone
 
  • Like
Likes berkeman and PeroK
Back
Top