Graphing the Superposition of Two Standing Waves

  • #1
TRB8985
74
15
Homework Statement
See message body for full problem statement.
Relevant Equations
ω_n = 2πf_n ; k_n = 2π/λ_n ; f_n = v/2L ; L = n*λ/2
Good evening,

I'm working on the following problem and running into a little trouble:

1699825201038.png


Part (a) and (b) were super easy, but I have a question on part (c).

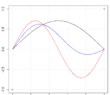
I'm trying to graph the total wave at ##t=0##, and it says I should get something that looks like this:

1699832493646.png


My graph doesn't even remotely look like that, though. It's more like this:

1699832840346.png


For context, here's what I did.
At ##t=0##, I switched out ##sin(\omega t)## for ##\cos(\omega t)##, and the first wave function reduced to this: $$y_1(x,0) = sin(k_1x)$$ Since I'm told that ##\omega_1 = vk_1##, I rewrote ##y_1## in the following form: $$=sin(\frac {\omega_1}{v}x)$$ $$=sin(\frac {2\pi f_1}{v}x)$$ $$=sin(\frac {2\pi \cdot \frac {v}{2L}}{v}x)$$ $$=sin(\pi \cdot \frac {x}{L})$$ The process was similar with the 2nd wave function, where I used the expression of the
2nd fundamental frequency (##f_2 = 2 \cdot \frac {v}{2L}##) to get a result of: $$y_2(x,0)=sin(2\pi \cdot \frac {x}{L})$$ My thought was to plot ##x## in terms of ##L## in order to eliminate ##L## in the trig argument.
The Excel spreadsheet I used had a pattern like this: $$
\begin{array}{|c|c|c|c|}
\hline x(L) & y_1(x,0) & y_2(x,0) & y_1 + y_2 \\
\hline 0L & 0 & 0 & 0 \\
\hline L/4 & \frac {1}{\sqrt{2}} & 1 & \frac {1}{\sqrt{2}} + 1 \\
\hline L/2 & 1 & 0 & 1 \\
\hline 3L/4 & \frac {1}{\sqrt{2}} & -1 & \frac {1}{\sqrt{2}} - 1 \\
\hline ... & ... & ... & ... \\
\hline 13L/4 & -\frac {1}{\sqrt{2}} & 1 & -\frac {1}{\sqrt{2}} + 1 \\
\hline
\end{array} $$

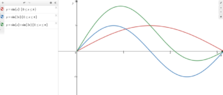
Then with that ready, the last step was to graph ##y_1 + y_2## vs. ##x##, leading to the funky-looking plot above.

I'm not entirely sure where I went wrong... was my approach totally out in left-field?
Would appreciate any feedback on why my plot looks so wild compared to the expected one.

Thank you!
 
Physics news on Phys.org
  • #2
Put lines for y1 and y2 on the same graph. That should show you where you went wrong.
It should look like this, with black for y1, red for y2 and blue for the sum:
1699838355781.png


By the way, did you notice your graph appears to have a period of 2 (ie it restarts the pattern at x=2) whereas it looks from your horizontal scale that you expected it to have a period of pi? That may also help locate the error.
 

Attachments

  • 1699838091640.png
    1699838091640.png
    18 KB · Views: 25
  • #3
Hey Andrew,

Thanks for the heads-up! After reviewing, I'd definitely agree that the period should be ##\pi## instead of 2.
Based on the work I posted above, that would imply that ##L=\pi## and that: $$y_1(x,0)=sin(x)$$ $$y_2(x,0)=sin(2x)$$ ... but unfortunately, I have no idea how to make that connection.
 
  • #4
TRB8985 said:
Hey Andrew,

Thanks for the heads-up! After reviewing, I'd definitely agree that the period should be ##\pi## instead of 2.
Based on the work I posted above, that would imply that ##L=\pi## and that: $$y_1(x,0)=sin(x)$$ $$y_2(x,0)=sin(2x)$$ ... but unfortunately, I have no idea how to make that connection.
What connection? The second harmonic has twice the frequency of the fundamental, ##\omega_2=2\omega_1##. At ##t=0## the snapshots of the waves are
##y_1(x)=\sin k_1x##
##y_2(x)=\sin k_2x##
Can you figure out the relation between ##k_1## and ##k_2## if you know the relation between the frequencies?
 
  • #5
Hey Kuruman,

Yeah that's pretty straightforward, no real trouble there.
##k_2## is pretty clearly ##2k_1##, which appears to be in line with my process in the post above,
where I had ##k_1## breaking down into ##\frac {\pi}{L}## and ##k_2## to ##2 \cdot \frac {\pi}{L}##.

To be more specific on what I meant by the connection involved, I was assuming that there's
some sort of way to algebraically find ##L=\pi##, such that the only variable left in the sine argument is ##x##.
When that's plotted, it lines up pretty nicely with what I shared as the provided answer:

Untitled2.png


But maybe there's no way to do that with the limited amount of information we have.

I guess my question is this:

Instead of breaking down ##k_1## and ##k_2## into the ratios I provided, are we supposed to
just recognize that ##k_2 = 2k_1## and just say that, for graphing purposes, ##k_1 = 1##?
Then ##k_2 =2## , and we get the expected functions of ##sin(x)## & ##sin(2x)##?

My apologies if that sounds confusing. Just making sure I'm understanding correctly.
 

Attachments

  • 1699874223524.png
    1699874223524.png
    9.1 KB · Views: 29
  • #6
First of all, you will never be able to show that ##L=\pi## because ##L## has units of length and ##\pi## is a dimensionless number. Look at ##y_1=\sin(k_1x)##. The argument of the sine must be dimensionless so ##k_1## must have units of inverse length.

Note that when ##k_1 =\frac{2\pi}{L}##, when ##x=L##, the wave goes through one complete cycle. This means that the quantity that you call ##L## is nothing other than the wavelength ##\lambda.##
TRB8985 said:
Instead of breaking down ##k_1## and ##k_2## into the ratios I provided, are we supposed to
just recognize that ##k_2 = 2k_1## and just say that, for graphing purposes, ##k_1 = 1##?
Then ##k_2 =2## , and we get the expected functions of ##sin(x)## & ##sin(2x)##?
That would work. The important item to note is that the argument of one sine is twice that of the other. You need to plot two sines whose arguments have that relation. If you multiply both arguments by the same number and replot, you will have two plots that look identical except that the horizontal axis will be labeled differently.
 
  • Like
Likes TRB8985
  • #7
kuruman said:
First of all, you will never be able to show that ##L=\pi## because ##L## has units of length and ##\pi## is a dimensionless number.
Oof.. I should have noticed that earlier! You're totally right. Lost sight of the basics there for a bit.

Everything else makes complete sense, and I think I should be good to finish this one up. Thanks for the assistance!
 
  • Like
Likes kuruman
  • #8
Be sure to post your answer to part (d).
 
  • #9
Here's the combined picture of all the waves in part (c), which I think helps visualize the correct answer to (d):

1699893207979.png


The black line is for ##t=0##, the red for ##t=\frac {1}{8f_1}##, the blue for ##t = \frac {1}{4f_1}##,
the green for ##t=\frac {3}{8f_1}##, and the yellow for ##t=\frac {1}{2f_1}##.
These wave functions all match what's in my solution manual, so I think it's all good there.

According to my textbook, a standing wave is one in which the nodes remain stationary.
Clearly, that isn't the case here, since the nodes change in location as time progresses.
 
Last edited:

1. What is a standing wave?

A standing wave is a type of wave that is formed when two identical waves with the same amplitude and frequency travel in opposite directions and interfere with each other. This interference results in a wave pattern that appears to be standing still.

2. What is the superposition of two standing waves?

The superposition of two standing waves refers to the combination of two standing waves that are traveling in opposite directions. The resulting wave pattern is the sum of the two individual waves, creating a complex pattern of constructive and destructive interference.

3. How do you graph the superposition of two standing waves?

To graph the superposition of two standing waves, you will need to plot the amplitude of each wave on the y-axis and the distance or time on the x-axis. Then, add the amplitudes of the two waves at each point to determine the resulting amplitude of the superposition wave.

4. What factors affect the superposition of two standing waves?

The amplitude, frequency, and phase of the two individual waves will affect the resulting superposition wave. The distance between the two waves and the medium through which the waves are traveling can also impact the superposition.

5. What is the significance of graphing the superposition of two standing waves?

Graphing the superposition of two standing waves allows us to visualize the complex wave pattern that results from the interference of two waves. It also helps us understand the concept of superposition and how it applies to other areas of science, such as quantum mechanics and signal processing.

Similar threads

  • Introductory Physics Homework Help
Replies
10
Views
927
  • Introductory Physics Homework Help
Replies
28
Views
369
  • Introductory Physics Homework Help
Replies
13
Views
986
  • Introductory Physics Homework Help
Replies
11
Views
1K
  • Introductory Physics Homework Help
Replies
16
Views
409
  • Introductory Physics Homework Help
Replies
5
Views
474
  • Introductory Physics Homework Help
Replies
4
Views
225
  • Introductory Physics Homework Help
Replies
10
Views
266
  • Introductory Physics Homework Help
Replies
28
Views
319
Replies
1
Views
143
Back
Top