Motion in 1D-Graphs: Is Option D Correct?

AI Thread Summary
The discussion revolves around the correctness of various options in a motion graph question, particularly focusing on Option D. Participants debate whether a body can have two velocities at the same position, concluding that while this is possible at different instances, it complicates the interpretation of the graphs. Concerns are raised about the accuracy of the distance vs. time graph and its relationship to the velocity vs. time graph, especially in the context of pendulum motion. Ultimately, the consensus shifts towards recognizing that none of the provided options may be entirely correct, prompting further exploration of the graphs related to a ball thrown upwards and a pendulum's motion. The conversation highlights the intricacies of understanding motion in one dimension and the significance of graph interpretations.
SpectraPhy09
Messages
23
Reaction score
3
Homework Statement
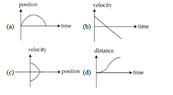
All the graphs below are intended to represent the same motion. One of them does it incorrectly. Pick it up (Please see the attached Image)
Relevant Equations
v=dx/dt
a=dv/dt
I think Option C should be correct
since the body has two velocities in the same position which is not possible. They even didn't show an arrow that could tell it has which velocity at its starting point and at the ending point
But the given and in my textbook is Option d ( It can have an error also).
Plz, can you also give your opinion? Which option do you think is correct also please give a reason.
 

Attachments

  • Motion in 1D_Tatva-ex-1 Doubt.png
    Motion in 1D_Tatva-ex-1 Doubt.png
    4.7 KB · Views: 127
Physics news on Phys.org
SpectraPhy09 said:
has two velocities in the same position which is not possible
If you have a pendulum clock, can the velocity at the bottom of the arc be different for the forward stroke compared to the return?
 
jbriggs444 said:
If you have a pendulum clock, can the velocity at the bottom of the arc be different for the forward stroke compared to the return?
No, it should be the same, but in opp direction. Is that correct?
Oh! so that graph in which the Velocity is different at the same position is correct. I actually thought that it can't have different velocities at the same position at the same instance but it can happen at two different instances.

But how is the option d correct then? Cant we draw a distance Vs Time graph like that? Also, distance is not decreasing with time so it should have been the correct graph.
 
SpectraPhy09 said:
But how is the option d correct then? Cant we draw a distance Vs Time graph like that? Also, distance is not decreasing with time so it should have been the correct graph.
Two exercises:
1) Sketch the four corresponding graphs for a ball thrown initially vertically upwards and then falling back to its start point.
2) If graph a) is correct, what should graph d) (the distance-time graph) look like?
 
I think graph a is correct because
Screenshot_2021-11-10-23-19-28-676.jpeg


So distance would be just flipping the graph from That point where the derivative becomes zero to the point where it intersect X-axis
It would look something like this
Screenshot_2021-11-10-23-23-02-846.jpeg

Also by first equation of motion Graph of V vs t would be similar to that in the option and Graph of V vs position would also be similar to that in the option

Now i think all graphs given in the ans are correct . None of the option is correct.
Is it so?
 
SpectraPhy09 said:
Now i think all graphs given in the ans are correct . None of the option is correct.
Is it so?
I agree with your graphs (for the case of a ball thrown upwards). But note that your distance-time graph does not look like graph (d) in the question.

For example your distance-time graph, at the instant height is maximum, has a gradient of zero. This is not true for graph (d) in the original question. (And note the gradients of these graphs have special meanings.)
 
SpectraPhy09 said:
No, it should be the same, but in opp direction. Is that correct?
That is correct. And since velocity is a vector, that means that you have one position where the velocity has two values.
 
Yes, I got the answer now(it should be d)
Thanks for Help 😊
 
SpectraPhy09 said:
Yes, I got the answer now(it should be d)
Thanks for Help 😊
Can you explain why d is wrong? I don’t get it.
Also how the graph c describes the pendulum motion? At t=0 velocity will be zero then it will increase and again zero and then it will change its direction
 
Last edited:
  • #10
rudransh verma said:
Can you explain why d is wrong? I don’t get it.
Compare the first half with the first half of graph a. How should those two compare?
rudransh verma said:
how the graph c describes the pendulum motion? At t=0 velocity will be zero
Not according to the velocity/time graph b.
 
  • #11
haruspex said:
Compare the first half with the first half of graph a. How should those two compare?
I guess the position doesn’t change as soon as time starts
haruspex said:
Not according to the velocity/time graph b.
graph b says velocity decreases becomes zero and then again increases in reverse direction.
Whereas graph c says there are two velocities at an instant.
What kind of motion does all this?
Do these graphs describe pendulum?
 
Last edited:
  • #12
rudransh verma said:
I guess the position doesn’t change as soon as time starts
You can make a much stronger statement about how the first halves of those two graphs should compare. One is displacement, in one direction, while the other is distance. For 1D motion, what is the difference between displacement and distance travelled?
rudransh verma said:
Whereas graph c says there are two velocities at an instant.
Graph c is velocity against position, not against time.
 
  • #13
haruspex said:
For 1D motion, what is the difference between displacement and distance travelled?
For motion in one direction s=d whereas for other directions s<d
Ok as soon as time starts s is not zero whereas d=0
 
  • #14
rudransh verma said:
For motion in one direction s=d
One dimension, not one direction. Think about that difference.
rudransh verma said:
as soon as time starts s is not zero whereas d=0
No, both start at zero here.
 
  • #15
haruspex said:
One dimension, not one direction. Think about that difference.
No I meant motion in 1D in one direction s=d whereas in other case s<d.
haruspex said:
No, both start at zero here.
I mean for some time d is not increasing as displacement is. It is flat whereas s is rising after t=0
 
  • #16
rudransh verma said:
graph b says velocity decreases becomes zero and then again increases in reverse direction.
Whereas graph c says there are two velocities at an instant.
What kind of motion does all this?
Do these graphs describe pendulum?
@rudransh verma - this exercise should help if you work through it:

Sketch these 4 graphs:
position vs. time​
velocity vs. time​
velocity vs. position​
distance traveled vs. time​
for both of the following cases:

1) a ball thrown vertically upwards at t=0 and then falls back to its start point; ignore air resistance; take ‘position’ to be the height above the start point;

2) one full cycle of a pendulum, released from rest from at its maximum negative placement, at t=0; take ‘position’ to be the x-coordinate with x=0 as the centre of oscillation;

If you post your 8 sketches, we might be able to help you clear up any misunderstandings (or confirm you have the correct understanding).

Edit - minor typo's corrected.
 
  • #17
Steve4Physics said:
Sketch these 4 graphs:
position vs. timevelocity vs. timevelocity vs. positiondistance traveled vs. time
1. Ball
2. Pendulum
I don’t know about the motion of a pendulum. Excuse me for wrong graphs
 

Attachments

  • image.jpg
    image.jpg
    35.9 KB · Views: 122
  • image.jpg
    image.jpg
    36.8 KB · Views: 111
  • #18
rudransh verma said:
1. Ball
2. Pendulum
I don’t know about the motion of a pendulum. Excuse me for wrong graphs
For the ball, your first 3 graphs look good. But you have drawn your distance-time graph as a straight line. Are you sure?
Is the distance-time graph related to the position-time graph?
What does the gradient of a velocity-time graph tell you?
What does the gradient of a distance-time graph tell you?

For the pendulum, you have only drawn graphs for half a cycle and (apart from velocity-position) the graphs are wrong. If you are interested in finding out why, it would probably be best if you started a separate thread as we have drifted away from the original topic.

An interesting exercise would be to make a simple pendulum, watch it carefully, and see if you can get the shape of the graphs directly from your observations.
 
  • #19
rudransh verma said:
No I meant motion in 1D in one direction s=d
Go from A to B in a straight line; s=d so far. Now go back to A. That's all 1D, but what about s and d now? Maybe try graphing those for constant speed.
rudransh verma said:
I mean for some time d is not increasing as displacement is. It is flat whereas s is rising after t=0
That is certainly a difference between the two graphs shown, but should they differ in that way?
 
Back
Top