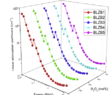
- #1
A 3D scatter plot with connected lines is a type of graph used to visualize data that has three variables. It is similar to a regular scatter plot, but with the addition of lines connecting the data points. This allows for a better understanding of the relationship between the variables.
To create a 3D scatter plot with connected lines, first, you need to have data with three variables. Then, you can use a software or programming language such as MATLAB or Python to plot the data points and connect them with lines. There are also online tools available for creating 3D scatter plots with connected lines.
One advantage of using a 3D scatter plot with connected lines is that it allows for the visualization of complex data with three variables. It also helps to identify patterns and trends in the data that may not be visible in a regular scatter plot. Additionally, the connected lines can show the direction and strength of the relationship between the variables.
A 3D scatter plot with connected lines is commonly used in fields such as engineering, physics, and biology. It is also useful in data analysis and visualization in industries such as finance and marketing. Additionally, it can be used in research studies to understand the relationship between multiple variables.
Interpreting a 3D scatter plot with connected lines involves looking at the overall pattern of the data points and the direction and strength of the connected lines. The closer the data points are to each other and the stronger the lines, the more significant the relationship between the variables. It is also essential to consider any outliers or unusual data points that may affect the interpretation of the graph.