Lambda96
- 233
- 77
- TL;DR
- Plot gradient vector in ContourPlot
Hi,
I have made the following ContourPlot in mathematica and now I wanted to ##\vec{r}_1= \left(\begin{array}{c} -1 \\ 1 \end{array}\right)##, ##\vec{r}_2= \left(\begin{array}{c} 0 \\ \sqrt{2} \end{array}\right)## and ##\vec{r}_3= \left(\begin{array}{c} 1 \\ 1 \end{array}\right)## insert the gradient into the ContourPlot.
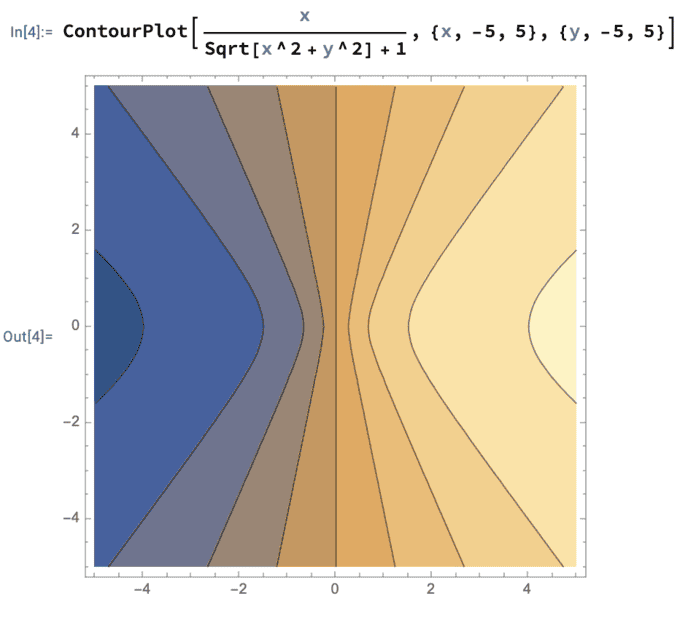
Is this possible and if so, how?
I have made the following ContourPlot in mathematica and now I wanted to ##\vec{r}_1= \left(\begin{array}{c} -1 \\ 1 \end{array}\right)##, ##\vec{r}_2= \left(\begin{array}{c} 0 \\ \sqrt{2} \end{array}\right)## and ##\vec{r}_3= \left(\begin{array}{c} 1 \\ 1 \end{array}\right)## insert the gradient into the ContourPlot.
Is this possible and if so, how?
