Question regarding a decay spectrum graph

Join the discussion
Registration is free. Ask a follow-up in this thread, or start your own.
2 replies · 2K views
dark_nebula
Messages
2
Reaction score
0
Homework Statement
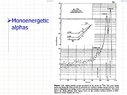
What the exact meaning or definition of « channel » written as the axis label in the graph?
Relevant Equations
It is a figure of the alpha particle groups produced in the decay of Pu(238)
I am not sure what is the description of Channel.
 

Attachments
  • 7338AAB0-1CEE-4684-975A-2AEB129886BF.jpeg
    7338AAB0-1CEE-4684-975A-2AEB129886BF.jpeg
    62.9 KB · Views: 173
Physics news on Phys.org
The detector being used produces pulses of different heights, depending on how much energy is deposited in the detector. The pulses are then fed into a device called a multi-channel analyzer, which groups the pulses according to height, with the lowest pulse heights going into the first channel and the highest pulse heights going into the highest numbered channel. In that sense it's like a histogram. So the channel is just a number that corresponds to pulse height, which corresponds to energy. Then you calibrate the channels with a spectrum with decays of a known energy, like the one you show. Does that make sense?
 
phyzguy said:
The detector being used produces pulses of different heights, depending on how much energy is deposited in the detector. The pulses are then fed into a device called a multi-channel analyzer, which groups the pulses according to height, with the lowest pulse heights going into the first channel and the highest pulse heights going into the highest numbered channel. In that sense it's like a histogram. So the channel is just a number that corresponds to pulse height, which corresponds to energy. Then you calibrate the channels with a spectrum with decays of a known energy, like the one you show. Does that make sense?
Yes, thanks a lot, now I totally understand.