Questions on ln and e^x graphs

  • Thread starter Thread starter Samurai44
  • Start date Start date
  • Tags Tags
    E^x Graphs Ln
Join the discussion
Ask a follow-up here, or get your own question answered by working scientists, mathematicians and engineers — people, not an autocomplete.
Real named experts · corrections over time · the nuance an AI answer skips
4 replies · 2K views
Samurai44
Messages
57
Reaction score
0
Greetings,
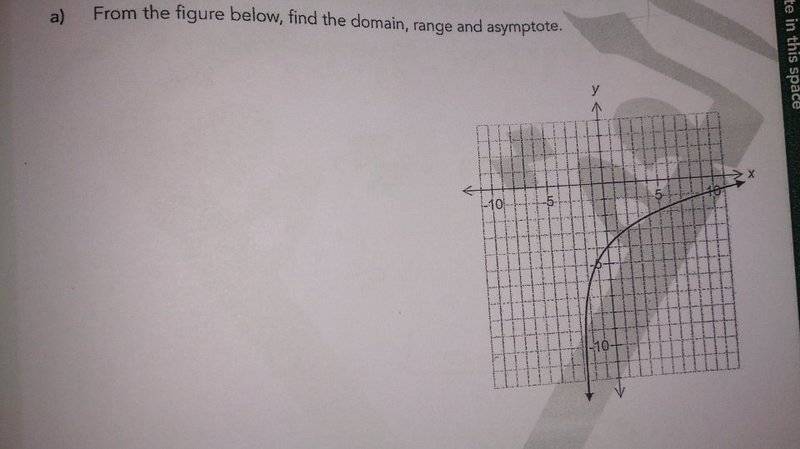
I have some questions about ln(x) and e^x graphs , with figuring out Domain , range and line of asymptote.
Q1) How can I know if this graph is ln(x) or e^x
DSC_1066.JPG

(I thought it was e^x graph since there's no x-axis intercept , however the answer in marking scheme is:
Domain : xεR , x>-3
Range : yεR
Ast. : x=-3

So it is ln(x) since there is a x-range/value in the domain .(correct me if i am wrong)

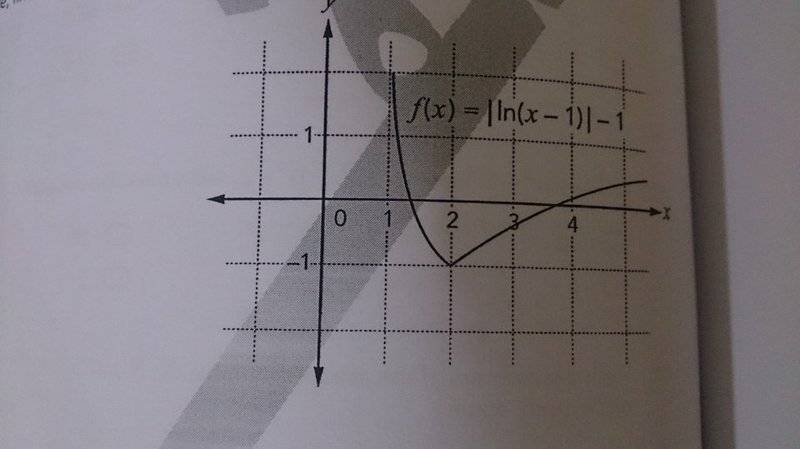
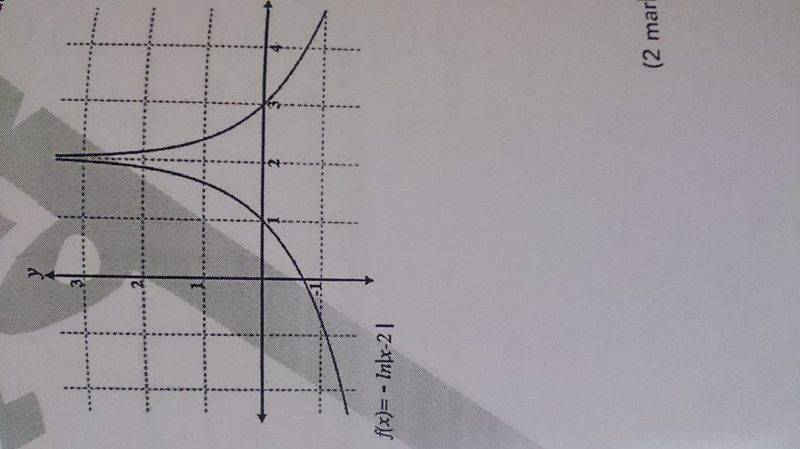
Q2) what's the difference between the two following two graphs ,, and how can I find the domain and range ?
DSC_1068.JPG


DSC_1067.JPG


Its the Modulus function that confuses me and make it hard to get the domain value.

*No calculations are required from the above question, as it says "from the figure ... "

Thank you,
 
Physics news on Phys.org
Those questions are weird. There is no way to derive the answers from the figures, other than some guessing.

For Q2 there are some formulas so you can work with that, but the graphs by themselves do not contain the information required, they only make sense as help in understanding the formulas.

Regarding the modulus, your formulas have the form ## \ln|X| ## where ## X ## is some expression - so you need to ask (a) what is the domain of the logarithm function, (b) what are the values of ## X ## such that its modulus falls in that domain, and (c) since ## X ## is an expression involving ## x ## , what are the corresponding values of ## x ## ?
 
Last edited:
For Q1 you can see the limits on ##x\to-\infty,\,x\to0,\,x\to+\infty## and compare with your graph.
 
*No calculations are required from the above question, as it says "from the figure ... "
The fact that it says no calculations are required doesn't mean you shouldn't use your calculator to evaluate some expressions where this will help you to establish range or domain of the equations.

Q1) How can I know if this graph is ln(x) or e^x
The plot is neither of these, not exactly. But it does match the shape of one. I suggest that on a sheet of graph paper you manually plot the graphs y = ln(x) and y = e× and having done that compare with the plot you are given.
 
theodoros.mihos said:
For Q1 you can see the limits on ##x\to-\infty,\,x\to0,\,x\to+\infty## and compare with your graph.

NascentOxygen said:
The fact that it says no calculations are required doesn't mean you shouldn't use your calculator to evaluate some expressions where this will help you to establish range or domain of the equations.The plot is neither of these, not exactly. But it does match the shape of one. I suggest that on a sheet of graph paper you manually plot the graphs y = ln(x) and y = e× and having done that compare with the plot you are given.

Thank you both