Questions regarding writing equations when given graphs

In summary: In response, the author suggests knowing that a zero exists at x=1 and that the vertical asymptote is at x=2-\pm3. The author also suggests solving for the constants a and b using a point on the graph and that b=1 when solving for a.
  • #1
mikea2424
2
0
Hello,

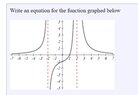
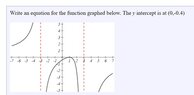
I'm studying for a test this Friday and I have two problems that have completely stumped me. I'm not sure how to solve either. Any help would be greatly appreciated.

View attachment 7234

View attachment 7235
 

Attachments

  • 1.jpg
    1.jpg
    6.7 KB · Views: 73
  • 2.jpg
    2.jpg
    7.3 KB · Views: 69
Mathematics news on Phys.org
  • #2
http://mathhelpboards.com/attachments/pre-calculus-21/7234d1503462274-questions-regarding-writing-equations-when-given-graphs-1-jpg

you should know these are both rational functions ... I leave the second graph for you to try.

for the first graph ...
(1) single zero at $x=1$
(2) y-intercept at $(0,-1)$
(3) horizontal asymptote appears to be $y=0$
(4) vertical asymptotes at $x=\pm2$, with the graph $\to +\infty$ for asymptote at $x=2$

$f(x)=\dfrac{a(x-1)}{b(x+2)(x-2)^2}$, where $a$ and $b$ are constants

$f(0)=-1=-\dfrac{a}{8b} \implies a=8b$. To fix $a$ and $b$ requires another point on the graph. I'm not going to try and eyeball another point, so to keep it simple, let $b=1$ ...
 
  • #3
Thank you very much for replying to my original post.
View attachment 7238

I know that there is a zero at x=1. I know this zero touches the x-axis meaning that it is an even multiplicity. So the top of the fraction should look like (x-1)^2. The vertical asymptotes are x= \pm3. So the bottom of the fraction looks like (x+3)(x-3). This is where I get confused..visibly I can't tell what the horizontal asymptote is. I also am unsure which of the bottom factors I am to square, if any at all. From my notes I can gather that if the parabola goes downward as well as the curves then I am to square one of the factors on the bottom. I have tried squaring each, one at a time and input my equation into Desmos with no luck. As of right now all I know for sure is:

a((x-1)^2)/((x+3)(x-3))
 

Attachments

  • 2.jpg
    2.jpg
    7.3 KB · Views: 59
  • #4
The fact there is a horizontal asymptote tells you (numerator degree) < (denominator degree)

As of right now all I know for sure is:

a((x-1)^2)/((x+3)(x-3))

note the function's behavior near the vertical asymptote $x = 3$ indicates the value $(x-3)$ in the denominator is squared ,,,

$f(x) = \dfrac{a(x-1)^2}{b(x+3)(x-3)^2}$

$f(0) = -0.4 \implies \dfrac{a}{27b} = -\dfrac{2}{5} \implies b = -\dfrac{5a}{54}$

once again, not having a second point on the curve other than an x or y intercept ...

let $a = 1 \implies b = -\dfrac{5}{54}$ ...

$f(x) = -\dfrac{54(x-1)^2}{5(x+3)(x-3)^2}$
 

Related to Questions regarding writing equations when given graphs

What is the purpose of writing equations when given graphs?

Writing equations when given graphs helps to represent the relationship between two variables in a clear and concise mathematical form.

What are the steps for writing equations when given graphs?

The steps for writing equations when given graphs include identifying the variables, determining the type of relationship shown in the graph, finding the slope and intercepts, and writing the equation in the form y = mx + b.

What information can be determined from a graph and its corresponding equation?

A graph and its corresponding equation can provide information about the relationship between two variables, the slope and intercepts of the line, and the value of one variable when the other is known.

How can writing equations from graphs be useful in real-life situations?

Writing equations from graphs can be useful in real-life situations such as predicting future outcomes, analyzing trends and patterns, and making informed decisions based on data.

What are some common mistakes when writing equations from graphs?

Some common mistakes when writing equations from graphs include misinterpreting the slope and intercepts, using the wrong formula, and not considering the units of measurement. It's important to double-check all calculations and make sure they align with the data presented in the graph.

Similar threads

  • General Math
Replies
4
Views
856
  • General Math
Replies
2
Views
810
Replies
7
Views
2K
  • General Math
Replies
0
Views
38
Replies
1
Views
1K
Replies
6
Views
2K
Replies
4
Views
1K
Replies
7
Views
1K
  • General Math
Replies
1
Views
894
Replies
4
Views
2K
Back
Top