LearninDaMath
- 295
- 0
note
Please note: I am not asking for the answer, nor am I asking how to solve a) or b). This question is about what it means that h is changing as θ is changing.
textbook question
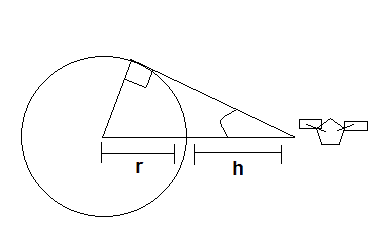
An Earth observing satellite can see only a portion of the Earth's surface. The satellite has horizon sensors that can detect the angle θ shown in the accompanying figure. Let r be the radius of the Earth and h the distance of the satellite from the Earth's surface.
a) show that h = r(cscθ -1)
b)Using r = 6378km, find the rate at which h is changing with respect to θ when θ = 30 degrees. Express in km/degree
question
The illustration for this question is:
How/why is h changing as the angle changes? Does this imply the Earth is traveling in some direction or rotating? Or does it imply the satellite is changing is traveling in some direction...or rotating? It seems like the answer is implying that the satelite getting closer to the Earth as the angle changes? Why?
Please note: I am not asking for the answer, nor am I asking how to solve a) or b). This question is about what it means that h is changing as θ is changing.
textbook question
An Earth observing satellite can see only a portion of the Earth's surface. The satellite has horizon sensors that can detect the angle θ shown in the accompanying figure. Let r be the radius of the Earth and h the distance of the satellite from the Earth's surface.
a) show that h = r(cscθ -1)
b)Using r = 6378km, find the rate at which h is changing with respect to θ when θ = 30 degrees. Express in km/degree
question
The illustration for this question is:
How/why is h changing as the angle changes? Does this imply the Earth is traveling in some direction or rotating? Or does it imply the satellite is changing is traveling in some direction...or rotating? It seems like the answer is implying that the satelite getting closer to the Earth as the angle changes? Why?