Etheryte
- 3
- 0
1. Homework Statement
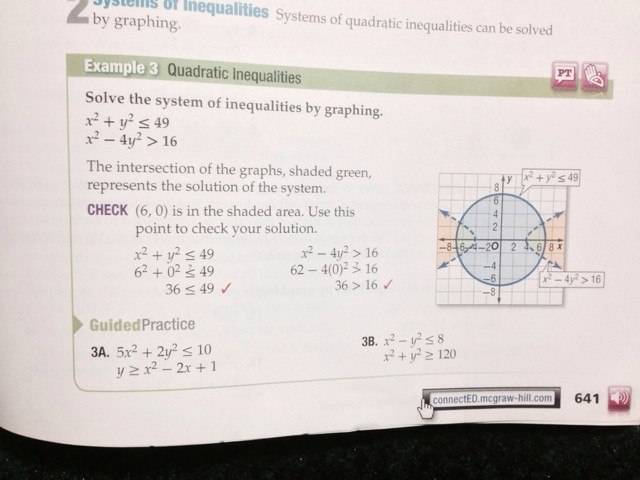
In a chapter in a book I'm studying from, they introduce quadratic inequalities (all conics, not just parabolas) but don't go over how to deduce which portion of the graph should be shaded. Considering there's two variables involved in these inequalities, I've been having trouble understanding without someone guidance.
I've included an image of one of their example problems of the two that were provided in the book.
2. Homework Equations
Circle has one standard form only, as for the rest the equation that's on a horizontal axis centered at origin and the second equation is on the vertical axis can be achieved by interchanging x and y. To manipulate the center, replace x^2 with (x-h)^2 and y^2 with (y-k)^2 (except for the parabola).
Standard Form of a Circle: x^2+y^2=r^2 (radius)
Standard Form of an Ellipse: x^2/a + y^2/b = 1
Standard Form of a Parabola: y = a(x-h)^2+k
Standard Form of a Hyperbola: x^2/a - y^2/b = 1
3. The Attempt at a Solution
After simplifying the second equation into it's standard form for example, I ended up with:
x^2/16 - y^2/4 > 1
I understand what the ellipse looks like and how to graph it and everything — but I don't understand what the "> 1" implies. I can understand that it means shade inside the conic section from the graph they've provided — but what does this imply for circles? Other hyperbolas?
I'm sorry, I'm completely lost on this chapter.
Andrew
In a chapter in a book I'm studying from, they introduce quadratic inequalities (all conics, not just parabolas) but don't go over how to deduce which portion of the graph should be shaded. Considering there's two variables involved in these inequalities, I've been having trouble understanding without someone guidance.
I've included an image of one of their example problems of the two that were provided in the book.
2. Homework Equations
Circle has one standard form only, as for the rest the equation that's on a horizontal axis centered at origin and the second equation is on the vertical axis can be achieved by interchanging x and y. To manipulate the center, replace x^2 with (x-h)^2 and y^2 with (y-k)^2 (except for the parabola).
Standard Form of a Circle: x^2+y^2=r^2 (radius)
Standard Form of an Ellipse: x^2/a + y^2/b = 1
Standard Form of a Parabola: y = a(x-h)^2+k
Standard Form of a Hyperbola: x^2/a - y^2/b = 1
3. The Attempt at a Solution
After simplifying the second equation into it's standard form for example, I ended up with:
x^2/16 - y^2/4 > 1
I understand what the ellipse looks like and how to graph it and everything — but I don't understand what the "> 1" implies. I can understand that it means shade inside the conic section from the graph they've provided — but what does this imply for circles? Other hyperbolas?
I'm sorry, I'm completely lost on this chapter.
Andrew