Discussion Overview
The discussion revolves around a probability problem related to standard deviation and z-scores in statistics. Participants explore the calculation of probability between certain standard deviations from the mean and address issues with the correctness of submitted answers in an online schooling context.
Discussion Character
- Homework-related
- Mathematical reasoning
- Technical explanation
Main Points Raised
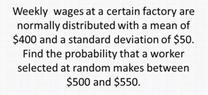
- One participant reports a probability of 2.14% and seeks feedback on this value.
- Another participant suggests converting raw data into z-scores and using a table to find the area under the standard normal curve.
- A later reply asserts that 2.14% is correct, indicating it represents the probability between 2 and 3 standard deviations from the mean.
- One participant mentions that their answer of 2.14% was not accepted by an online system, suggesting a potential misunderstanding regarding the format of the answer (percentage vs. decimal).
- Another participant provides a calculation using a statistical table and a numeric scheme to approximate the integral, arriving at a probability of approximately 0.0214.
- Participants discuss a glitch in the online system that may have affected the submission of answers.
Areas of Agreement / Disagreement
Participants express differing views on the correctness of the submitted answer and the format required by the online system. There is no consensus on the resolution of the issue with the online submission.
Contextual Notes
There are unresolved assumptions regarding the interpretation of the probability values and the specific requirements of the online system for answer submission.