Stark effect - theory vs experiment?

Join the discussion
Ask a follow-up here, or get your own question answered by working scientists, mathematicians and engineers — people, not an autocomplete.
Real named experts · corrections over time · the nuance an AI answer skips
3 replies · 3K views
jarekduda
Messages
82
Reaction score
5
Stark effect (shifting and splitting spectral lines due to external electric field) is calculated in nearly all QM textbooks as application of perturbation theory (alongside Zeeman).
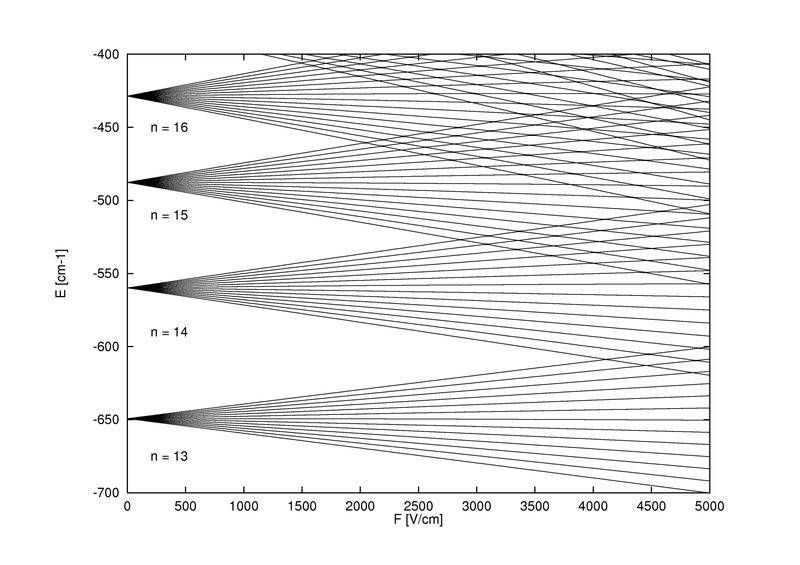
Wikipedia article ( https://en.wikipedia.org/wiki/Stark_effect ) has a nice figure with n-th level splitting into n-1 uniformly distributed sublevels:
Hfspec1.jpg


It is hard to find published experimental results - please cite if you know some.
A clear one for Lyman series (2->1, 3->1, 4->1) can be found in historical "Der Starkeffect der Lymanserie" by Rudolf Frerichs, published January 1934 in Annalen der Physic (its editors back then: W. Gerlach, F. Pashen, M. Planck, R. Pohl, A. Sommerfeld and M. Wien), here are its results:

https://dl.dropboxusercontent.com/u/12405967/stark.png

These are clearly not uniformly distributed - how to understand/repair this discrepancy?
 
Last edited by a moderator:
Physics news on Phys.org
The top plot is of energy states. But the experimental lines are transitions between energy states. Some transitions are forbidden so you don't get every combination of energy states. Also, the results are polarized, so depending on the angle of view, some lines may not be visible.

It's easiest to solve the Stark effect in the parabolic nkm basis
The linear Stark effect levels are (atomic units, Z=1):
##E = -\frac{1}{2n^2} + \frac{3}{2} E n k##
At higher fields and higher n, you may have large deviations from linear.

And if you have a combination of Zeeman and Stark, they won't be equally spaced. See, e.g.
Breton et al, J Phys B: Atom. Molec. Phys 13 (1980) 1703-1718

We typically measure Hydrogen Stark Effect as part of the Motional Stark Effect diagnostic in magnetically confined fusion plasmas (looking at n=3->2 transition). In our case, the Stark effect dominates and the visible lines are approximately equally spaced.
 
  • Like
Likes   Reactions: vanhees71, jarekduda and MisterX
Thank you Khashishi, but there still seems to be an inconsistency here, especially for Lyman-gamma (4 -> 1).
Could you maybe cite some paper which can explain these clearly not equally distributed sublevels for just electric field (Stark) ?
Or maybe some other experimental paper which includes Lyman-gamma?

I have done some searching starting with the 1934 Frerichs paper.
The journal and editors strongly suggest that top physicists of those times were aware of these experimental results - so one might expect it would have thousands of citations now, like all these QM textbooks.
Eventually, if it disagrees with quantum calculations, there should be now many papers clearing this situation ...

... but surprisingly this paper has just 3 citations (1939, 1992, 1996): https://scholar.google.pl/scholar?cites=15476592679702358817
The 1992 one concerns much higher levels (10->30, getting nearly equally spaced sublevels) and refers to only one experimental paper for Lyman series( ->1, the Frerichs') and 3 papers for Balmer series (->2). The second (1996) concerns Lyman-alpha (2->1).

Could anyone clarify the discrepancy for Lymann-gamma (4->2)? from theoretical or experimental side?
 
I have decided to perform the calculations (https://dl.dropboxusercontent.com/u/12405967/lyman.pdf ) as described http://www.physicspages.com/2013/09/02/stark-effect-in-hydrogen-for-n-3/.
So we need matrix <n,l,m| z^hat|n,l',m'> for fixed n (assuming degeneracy) and all n^2 possibilities for l and m.
Possible shifts are given by eigenvalues of this matrix (times a*E*e)
For n=3 we get eigenvalules: {-9, -9/2, 0, 9/2, 9} - it fits to Frerichs' results assuming we don't see the 0 line.

For n=4 we get eigenvalues: {-18,-12,-6, 0, 6, 12, 18} - visually it seems to fit Frerichs' results assuming we don't see the {-6, +6} lines.
However, he got (10^8/lam): {102630.5, 102684.2, 102823.6, 102964.4, 103021.7},
after subtracting average value we get {-194.38, -140.68, -1.28, 139.52, 196.82}
The proportions suggest that the external lines should be ~140 * 1.5 = 210, so the observed ones are essentially narrower than predicted.

How to repair this discrepancy ?
Maybe someone has some more recent experimental results for Lyman-gamma (4->1)?

update:
I have just found 1984 paper ( http://journals.aps.org/pra/abstract/10.1103/PhysRevA.30.2039 ) which starts with "Recent measurements of the Stark profiles of the hydrogen Lyman-alpha and -beta lines in an arc plasma have revealed a sizeable discrepancy between theoretical and experimental results" ...
 
Last edited by a moderator: