Truss behaviour, load-deformation curve

Click For Summary
SUMMARY

This discussion focuses on the analysis of an 18 m by 1.2 m truss using Abaqus for nonlinear finite element analysis (FEA) with S355 material. The user observed an abrupt drop in the load-displacement curve after yielding and questioned the yielding strength. Key factors include the need for proper restraint modeling at the supports and the importance of hand calculations to validate FEA results. The discussion emphasizes the significance of deformed geometry plots for assessing potential failure modes such as plastic buckling and joint failure.

PREREQUISITES
  • Understanding of nonlinear finite element analysis (FEA) using Abaqus
  • Knowledge of material properties, specifically S355 steel
  • Familiarity with load-deformation curves and their interpretation
  • Basic principles of structural analysis, including truss behavior and failure modes
NEXT STEPS
  • Explore the use of Abaqus for nonlinear material modeling and analysis
  • Learn about hand calculation techniques for truss analysis
  • Investigate the effects of joint rigidity on truss behavior
  • Study the significance of deformed geometry plots in FEA and how to adjust scaling factors
USEFUL FOR

Structural engineers, FEA analysts, and students studying truss behavior and load analysis will benefit from this discussion, particularly those interested in understanding nonlinear material behavior and validation of FEA results.

SofiaB
Messages
2
Reaction score
0
TL;DR
Hello everyone! I am just trying to verify if the results I obtained for my truss behaviour analysis are correct
Hello everyone!
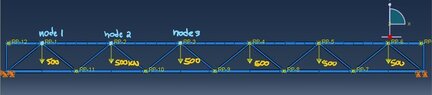
I am analysing an 18 m per 1.2 m truss, simply supported, with 140x5 chords and 90x8 braces. I then loaded the superior nodes with 500 KN. The top nodes were also laterally constrained to prevent out-of-plane displacements.
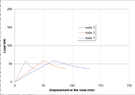
After imputing the structure in Abaqus (FEA software), I obtained the load-displacement curves in the top nodes where the concentrated loads were applied. I should note that I am doing a nonlinear analysis with a nonlinear material(S355).
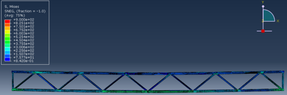
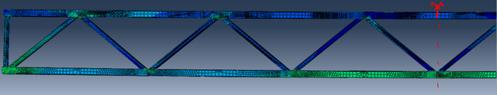
What I found weird was the abrupt drop in the curve after yielding, as well as the fact that the value of the yielding strength seems very small. Can someone help me understand if this behaviour is correct? I will leave some pictures of the truss, the material input and the load-displacement curves for each node for better understatement.

Should also note that ultimately what I am studying is the joints behaviour (in a further analysis I will increase their rigidity) and thus I want to explore the behaviour above the yield limit.

Thanks in advance!
 

Attachments

  • aaaaa.PNG
    aaaaa.PNG
    7.2 KB · Views: 229
  • 7.PNG
    7.PNG
    20.5 KB · Views: 261
  • Inked0_LI.jpg
    Inked0_LI.jpg
    16.3 KB · Views: 214
  • 8.PNG
    8.PNG
    19.5 KB · Views: 257
Engineering news on Phys.org
I like to look at a deformed geometry plot on all of my FEA analyses. Possible failure modes of a truss include plastic buckling of a compression member, elastic (Euler) buckling of a compression member, plastic yielding of a tension member, lateral buckling of the top member (which you restrained), and joint failure. The deformed geometry plot shows this, and is also useful as a check on your restraints and loads. And on how well you model joint rigidity, when you get that far.

It's also a good idea to do a hand calculation for the truss element that yielded or buckled.
 
Last edited:
jrmichler said:
I like to look at a deformed geometry plot on all of my FEA analyses. Possible failure modes of a truss include plastic buckling of a compression member, elastic (Euler) buckling of a compression member, plastic yielding of a tension member, lateral buckling of the top member (which you restrained), and joint failure. The deformed geometry plot shows this, and is also useful as a check on your restraints and loads. And on how well you model joint rigidity, when you get that far.

It's also a good idea to do a hand calculation for the truss element that yielded or buckled.
There were no signs of buckling as well as joint failure which I also found a little weird. I will leave some pictures of the deformed configuration and von mises stress values.
 

Attachments

  • Capturedeform.PNG
    Capturedeform.PNG
    20.5 KB · Views: 201
  • Capturedeform2.PNG
    Capturedeform2.PNG
    17.3 KB · Views: 190
The deformed geometry plot needs to be scaled such that the peak deformation is larger and more visible. Typical FEA defaults make the peak deformation about 10% of the truss depth. You might need to put a scale factor in there.

Are the end supports simple supports, or rigid? It makes a difference. One end support should restrain in both horizontal and vertical directions, the other should restrain in the vertical direction only. Both should restrain in the out of page direction.

This is a simple truss to analyze by hand. What is the hand calculated stress in the top and bottom members near the middle of the truss and away from the joints? How does that compare to the FEA values?
 

Similar threads

  • · Replies 5 ·
Replies
5
Views
2K
  • · Replies 18 ·
Replies
18
Views
6K
  • · Replies 2 ·
Replies
2
Views
2K
  • · Replies 1 ·
Replies
1
Views
3K
  • · Replies 2 ·
Replies
2
Views
3K
  • · Replies 2 ·
Replies
2
Views
2K
  • · Replies 4 ·
Replies
4
Views
2K
Replies
4
Views
2K
  • · Replies 2 ·
Replies
2
Views
5K
Replies
3
Views
2K