Velocity-time graph from distance-time table

Join the discussion
Ask a follow-up here, or get your own question answered by working scientists, mathematicians and engineers — people, not an autocomplete.
Real named experts · corrections over time · the nuance an AI answer skips
6 replies · 3K views
Sh4dman
Messages
4
Reaction score
1
Homework Statement
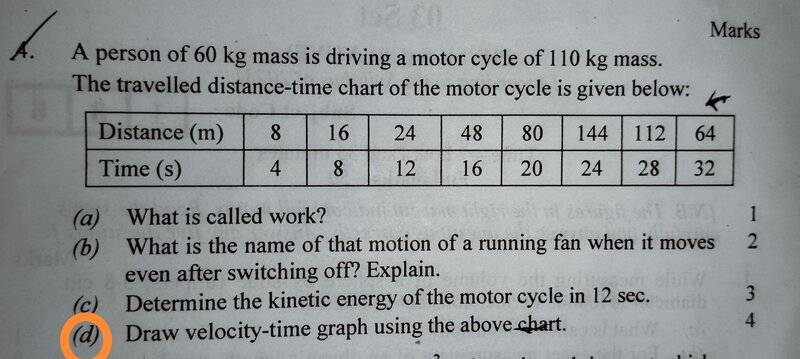
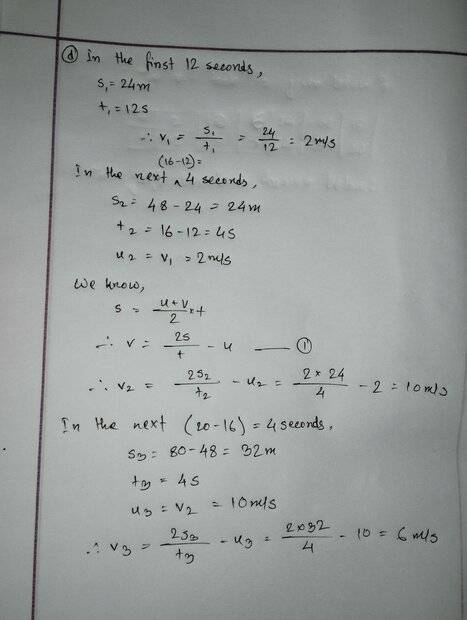
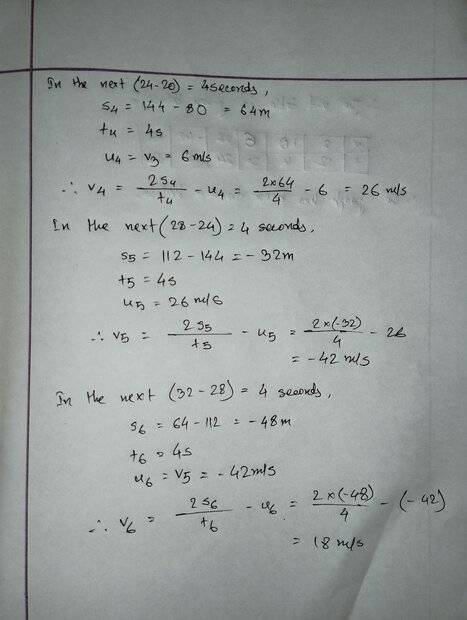
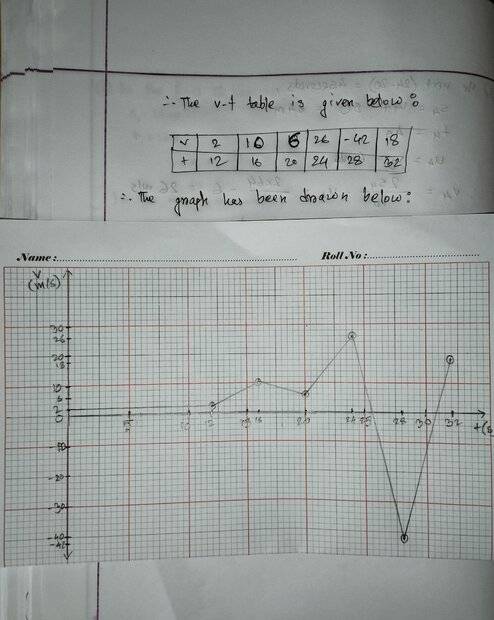
A distance-time graph has been given, and I'm required to draw the v-t graph (question has been added with attempt at solution as a picture. It's question d of no.2.) I've added my answer but I don't know if it's correct or not.
Relevant Equations
s = vt
s = (u + v)t/2
Question:
IMG_20230515_101407.jpg

Answer:
IMG_20230515_101220.jpg
IMG_20230515_101230.jpg
IMG_20230515_101309.jpg
 
Physics news on Phys.org
Part d) is not clear to me. When it says distance, does it mean displacement? Does it assume constant acceleration in each phase of 4 seconds? Why would a motorcycle only change speed every four seconds? Is the starting speed zero or 2m/s? You can't tell even that from the data given.

Are these distances in each period of four seconds? Distance can never be negative, so that would make more sense.
 
Reply
  • Like
Likes   Reactions: MatinSAR
PeroK said:
Part d) is not clear to me. When it says distance, does it mean displacement? Does it assume constant acceleration in each phase of 4 seconds? Why would a motorcycle only change speed every four seconds? Is the starting speed zero or 2m/s? You can't tell even that from the data given.

Are these distances in each period of four seconds? Distance can never be negative, so that would make more sense.
I think by distance, the question probably means the total displacement from an initial point. Could be a translation error as english version questions are generally translated from our other language.
As for the question related to the initial speed, should I have started the graph from t = 4s?
 
Sh4dman said:
I think by distance, the question probably means the total displacement from an initial point. Could be a translation error as english version questions are generally translated from our other language.
As for the question related to the initial speed, should I have started the graph from t = 4s?
I'd stick with what you have. One way to check is to do a step function or bar graph showing the average velocity for each period of 4 seconds. Your graph should bisect the bar graph at the midpoint of each bar. If that makes sense.
 
PeroK said:
I'd stick with what you have. One way to check is to do a step function or bar graph showing the average velocity for each period of 4 seconds. Your graph should bisect the bar graph at the midpoint of each bar. If that makes sense.
By midpoint of the bars, do you mean like the exact center of the bars?
 
Sh4dman said:
By midpoint of the bars, do you mean like the exact center of the bars?
Yes. That's another way to do the problem. Start with the "frequency polygon" and draw the velocity from that.

Although, I'd say: draw a graph of average velocity first and use that to draw the velocity graph.
 
PeroK said:
Yes. That's another way to do the problem. Start with the "frequency polygon" and draw the velocity from that.

Although, I'd say: draw a graph of average velocity first and use that to draw the velocity graph.
IMG_20230515_145717.jpg

Is this what you meant by the graphs bisecting?
 
Reply
  • Like
Likes   Reactions: PeroK