Venn diagram and table word problem Help

Click For Summary
SUMMARY

The discussion focuses on creating Venn diagrams from data tables, specifically using statistics from the CDC's Zika virus page. Participants emphasize the need for clarity in data representation, noting that effective Venn diagrams typically require three overlapping sets, which may not be achievable with the provided Zika data. The conversation highlights the importance of using proper tools for diagram creation, whether through word processing software or manual drawing, to enhance legibility and understanding.

PREREQUISITES
  • Understanding of Venn diagrams and their construction
  • Familiarity with data representation techniques
  • Basic skills in word processing software (e.g., Microsoft Word, Google Docs)
  • Knowledge of interpreting statistical data from sources like the CDC
NEXT STEPS
  • Research how to create Venn diagrams using Microsoft Word
  • Explore online tools for diagram creation, such as Lucidchart or Canva
  • Learn about data visualization principles to enhance clarity
  • Investigate the types of data sets suitable for Venn diagram representation
USEFUL FOR

This discussion is beneficial for students, educators, and data analysts who need to visualize data relationships effectively, particularly in academic settings or research presentations.

bke0712
Messages
4
Reaction score
0
I have started and stopped doing this 10x bc i keep doing it wrong. Can someone please help!

Question:
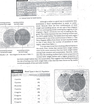
Find two news articles or research reports with a table similar to the ones on the second page of the attached pdf of a group activity used in my F2F sections. You are to draw a Venn Diagram to represent the data in each table. Use proper tools to make your diagrams, they may be done with via word processing or by hand. You must include your tables with your diagrams.

View attachment 5772I wanted to use these statistics

http://www.cdc.gov/zika/geo/united-states.html

Please help!
 

Attachments

  • Screen Shot 2016-07-20 at 6.27.03 PM.png
    Screen Shot 2016-07-20 at 6.27.03 PM.png
    21.2 KB · Views: 133
Physics news on Phys.org
Your image is not legible enough to understand how a table is used to construct a Venn diagram. For such diagram, you need (typically) three overlapping sets. It is not clear how the data on the Zika virus provides such three sets.

It may help if you describe what you tried and why you thought it was wrong.
 

Similar threads

  • · Replies 1 ·
Replies
1
Views
3K
  • · Replies 4 ·
Replies
4
Views
3K
Replies
1
Views
2K
  • · Replies 1 ·
Replies
1
Views
2K
  • · Replies 6 ·
Replies
6
Views
4K
  • · Replies 13 ·
Replies
13
Views
3K
  • · Replies 2 ·
Replies
2
Views
5K
  • · Replies 8 ·
Replies
8
Views
2K
  • · Replies 6 ·
Replies
6
Views
3K
  • · Replies 5 ·
Replies
5
Views
2K