Voltage-resistance graph for this circuit with a variable resistance

Click For Summary
SUMMARY

The discussion centers on the voltage-resistance (V-R) graph for a circuit with a variable resistance (Rv) and a fixed resistance (Rf), both set at 600 ohms. The expected voltage across each resistor was calculated to be 3V, given a 6V battery. However, the actual measurements indicated Vf at 3.4V and Vv at 2.6V, leading to confusion regarding the graph's linearity and the intersection point at 700 ohms. The potential divider equation provided, Vfixed = Vbatt x [600 / (600 + Rvariable)], is confirmed to represent a hyperbolic relationship, not a straight line.

PREREQUISITES
  • Understanding of Ohm's Law and voltage division principles
  • Familiarity with circuit analysis and resistor configurations
  • Knowledge of graph interpretation in electrical engineering
  • Basic proficiency in using graphing tools for circuit simulations
NEXT STEPS
  • Study the principles of voltage dividers in electrical circuits
  • Learn how to derive and apply the potential divider equation
  • Explore graphing techniques for circuit analysis using software like MATLAB or Python
  • Investigate the effects of varying resistance on voltage distribution in circuits
USEFUL FOR

Electrical engineering students, circuit designers, and anyone interested in understanding voltage distribution in resistor networks.

shirozack
Messages
37
Reaction score
3
Homework Statement
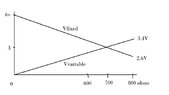
a 600 ohm fixed resistor Rf is connected in series with a variable resistor Rv that goes from 0-800ohms. the battery is 6V.

when Rv is 0ohm, the voltage Vf across the Rf is 6V. Vv is 0V.

when Rv is 800 ohm, Vf is 2.6V and Vv is 3.4V

Plot the v-r graph of both Vf and Vv (from 0 to 6V) against Rv (from 0-800 ohms)
Relevant Equations
na
I have plotted the V-R graph.

when Rv is 600 ohms, Rf is also 600ohms, which means the voltage across both resistors should be split evenly at 3V each since batt is 6V.

however, from the graph, i noticed that Vf is 3.4V and Vv is 2.6V instead at 600 ohms.

i would like to know where did it go wrong? are the graphs not supposed to be a straight line?

why is the intersection at 700 ohms instead which is 3V.

thanks
 

Attachments

  • 1.jpg
    1.jpg
    13.8 KB · Views: 72
Physics news on Phys.org
shirozack said:
are the graphs not supposed to be a straight line?
Why should they be? Can you write the equation?
 
haruspex said:
Why should they be? Can you write the equation?
this was the answer given by the teacher. is it wrong?

the potential dividing equation?

Vfixed = Vbatt x [ 600 / (600+Rvariable) ] ?

so it's like a 1/x curve?
 
shirozack said:
this was the answer given by the teacher. is it wrong?

the potential dividing equation?

Vfixed = Vbatt x [ 600 / (600+Rvariable) ] ?

so it's like a 1/x curve?
Yes, similar to that.
 

Similar threads

  • · Replies 5 ·
Replies
5
Views
2K
Replies
3
Views
2K
  • · Replies 21 ·
Replies
21
Views
11K
Replies
2
Views
6K
  • · Replies 10 ·
Replies
10
Views
3K
  • · Replies 12 ·
Replies
12
Views
2K
  • · Replies 4 ·
Replies
4
Views
2K
  • · Replies 9 ·
Replies
9
Views
2K
  • · Replies 7 ·
Replies
7
Views
4K
  • · Replies 6 ·
Replies
6
Views
3K