Discussion Overview
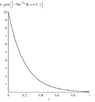
The discussion revolves around the definite integral of the function $$y=-50e^{-5x}$$ and the confusion regarding the negative value obtained from the integral despite the graphical representation suggesting otherwise. Participants explore the implications of integrating a function that is always negative over a specified interval.
Discussion Character
- Technical explanation
- Conceptual clarification
- Debate/contested
Main Points Raised
- One participant notes that the function $$-50e^{-5x}$$ is always negative for $$x$$ in the range from 0 to 1, leading to a negative definite integral.
- Another participant questions the interpretation of the area under the curve, suggesting confusion about how the integral relates to the area bounded by the function and the axes.
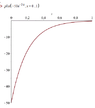
- A third participant points out that the integral function itself is positive but decreasing, which could contribute to misunderstandings about the values obtained from the definite integral.
- There is mention of the need to account for a constant of integration when graphing the indefinite integral, which may shift the graph downwards.
Areas of Agreement / Disagreement
Participants express differing views on the interpretation of the integral's value and its graphical representation. There is no consensus on how to reconcile the negative integral with the graphical depiction of the area under the curve.
Contextual Notes
Some participants highlight the importance of understanding the relationship between the definite integral and the area under the curve, noting that the integral's value reflects the area below the x-axis, which may lead to confusion.