I have the data and need to make a prediction based on it (probability)

In summary, the conversation discusses using linear regression to make a prediction for the number of births in the year 2010. The given line of y=-0.1103x+234.98 represents this relationship, with x representing the years. Plugging in x=2010 gives a prediction of 13.277 births.
  • #1
chriskeller1
6
0
Hello Everyone,
I really can't understand stats and it's driving me crazy.

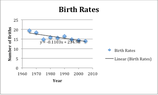
I have data for births linked with different years, the graphic looks like this
View attachment 3382
But I need to make a prediction on the births in year 2010. How do I go about that?!
 

Attachments

  • Screen Shot 2014-10-08 at 9.39.48 PM.png
    Screen Shot 2014-10-08 at 9.39.48 PM.png
    4.2 KB · Views: 40
Mathematics news on Phys.org
  • #2
It looks like you are provided with the linear regression:

\(\displaystyle y=-0.1103x+234.98\)

Can you see what you need to use for $x$ to get a prediction for the year 2010?
 
  • #3
I'm confused... Isn't x supposed to represent the years?
 
  • #4
chriskeller1 said:
I'm confused... Isn't x supposed to represent the years?

Yes, it appears to me that the independent variable $x$ is the year, and this input into the given line will give a prediction for the output, the dependent variable which is the birth rate, for that year.

So, use $x=2010$ in the given line, and what do you find?
 
  • #5
Oh, so basically it's going to be 13.277?

Thank you!
 
  • #6
chriskeller1 said:
Oh, so basically it's going to be 13.277?

Thank you!

Yes, that's the same value I get. (Yes)
 

1. What is probability?

Probability is a measure of the likelihood of an event occurring. It is expressed as a number between 0 and 1, where 0 indicates impossibility and 1 indicates certainty.

2. How do you calculate probability?

To calculate probability, you divide the number of favorable outcomes by the total number of possible outcomes. This is known as the probability formula: P(A) = Number of favorable outcomes / Total number of possible outcomes.

3. What is the difference between theoretical and experimental probability?

Theoretical probability is the probability of an event occurring based on mathematical calculations and assumptions. Experimental probability is the probability of an event occurring based on actual data collected from experiments or real-life situations.

4. How do you use data to make a prediction based on probability?

To make a prediction based on probability, you can analyze the data to determine the frequency of certain outcomes and use that information to make an educated guess about the likelihood of a particular event occurring in the future.

5. What are some common applications of probability in science?

Probability is used in a wide range of scientific fields, such as physics, biology, and psychology. Some common applications include predicting weather patterns, evaluating the effectiveness of medical treatments, and analyzing data in genetics and evolution.

Similar threads

  • General Math
Replies
1
Views
817
  • General Math
Replies
7
Views
766
Replies
4
Views
4K
Replies
3
Views
949
  • General Math
Replies
1
Views
2K
  • Set Theory, Logic, Probability, Statistics
Replies
1
Views
997
  • General Math
Replies
19
Views
1K
  • General Math
Replies
31
Views
1K
Replies
2
Views
845
Back
Top