Statistics and Probabilities: How many type A pigs from the farm's herd of 1,000 pigs have 3 DYL blood?

  • #1
Memo
35
3
Mentor note: Thread moved from technical section to here, so is missing the homework template.
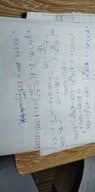
TL;DR Summary: The weight of DYL 3-blood hybrid pigs after correction of a farm is a random quantity with a normal distribution. Knowing that the probability of a pig weighing over 20 kg is 0.1587 and over 25 kg is 0.0228. If the pig weighs over 19 kg, it is called type A pig. How many type A pigs from the farm's herd of 1,000 pigs have 3 DYL blood?

Sample size=1000
P(x>20)=0.11857
P(x>25)=0.0228
 
Last edited by a moderator:
Physics news on Phys.org
  • #2
Hello,

Is this schoolwork? If so, did you read about using the homework templates? To get help with schoolwork, you need to show what you have tried, then we will guide you in the right direction.
 
  • #3
scottdave said:
Hello,

Is this schoolwork? If so, did you read about using the homework templates? To get help with schoolwork, you need to show what you have tried, then we will guide you in the right direction.
Sorry, I don't know where to start, I'm not familiar with this type of task. There's no sample mean the p(x=19) so I really don't know where to start. Please help me🥺
 
  • #4
Memo said:
There's no sample mean
You don't need the sample mean, but you do need the population mean ##\mu## and population standard deviation ##\sigma##. Are these given? If so the problem would be relatively easy to solve.
 
  • #5
Mark44 said:
You don't need the sample mean, but you do need the population mean ##\mu## and population mean standard deviation ##\sigma##. Are these given? If so the problem would be relatively easy to solve.
They're not given
 
  • #6
Memo said:
Knowing that the probability of a pig weighing over 20 kg is 0.1587
That is exactly the probability of being over 1 standard deviation above the mean for a normal distribution.
Memo said:
and over 25 kg is 0.0228.
Can you find this probability in a standard normal table? If so, you can figure out what the standard deviation is. And then use my comment above to determine the mean.
Memo said:
If the pig weighs over 19 kg, it is called type A pig. How many type A pigs from the farm's herd of 1,000 pigs have 3 DYL blood?

Sample size=1000
P(x>20)=0.11857
That probability does not match the probability given above.
Memo said:
P(x>25)=0.0228
Ok.
 
  • #7
FactChecker said:
That is exactly the probability of being over 1 standard deviation above the mean for a normal distribution.

Can you find this probability in a standard normal table? If so, you can figure out what the standard deviation is. And then use my comment above to determine the mean.

That probability does not match the probability given above.

Ok.
There's no table, the task only gives us the two proportions (as seen above) and the sample size.
 
  • #8
Memo said:
There's no table, the task only gives us the two proportions (as seen above) and the sample size.
CORRECTION: Maybe this is about a binomial approximation to normal.
CORRECTION TO THE CORRECTION: This original post was probably what the problem wanted.
See post #6 and @scottdave 's post #14.

Why else would the problem state that it was a normal distribution? Without that, there is no unique answer. Don't you have a textbook and the usual probability tables? Is this for a class? In any case, you can find the standard normal tables on the internet.
 
Last edited:
  • #9
FactChecker said:
Why else would the problem state that it was a normal distribution? Without that, there is no unique answer. Don't you have a textbook and the usual probability tables? Is this for a class? In any case, you can find the standard normal tables on the internet.
Sorry, my English isn't good. I thought you were asking about the dataset. I'm provided with the normal distribution but I don't see how it's gonna help
 

Attachments

  • 16980421139916968698401188579563.jpg
    16980421139916968698401188579563.jpg
    64.5 KB · Views: 35
  • 16980421495315168130189142427057.jpg
    16980421495315168130189142427057.jpg
    55.6 KB · Views: 27
  • #10
FactChecker said:
CORRECTION: Maybe this is about a binomial approximation to normal.
Why else would the problem state that it was a normal distribution? Without that, there is no unique answer. Don't you have a textbook and the usual probability tables? Is this for a class? In any case, you can find the standard normal tables on the internet.
You mean using the formula in the photo below? Could you tell me what to do next if I can search for the numbers?
 

Attachments

  • 16980426937837193367520174388163.jpg
    16980426937837193367520174388163.jpg
    29.3 KB · Views: 30
  • #11
I'd say the 1-2-3, aka 68-95-99.7 rule of normal distribution should come in handy.
 
  • #12
WWGD said:
I'd say the 1-2-3, aka 68-95-99.7 rule of normal distribution should come in handy.
There's no population mean and SD
 
  • #13
Memo said:
There's no population mean and SD
True, but you can use the rule to find/approximate it.
 
  • #14
Your tables give the probabilities that something is less than the value. The problem gives probabilities of greater than (more than 20 kg, more than 25 kg). So you need to find the values (1 - 0.1587) and (1 - 0.0228) in the table.

How many Standard Deviations separate these two values? How many kilograms separate these two values? proceed from there.

I believe your p(>20) = 0.11587 is a typo: " probability of a pig weighing over 20 kg is 0.1587 "
 
Last edited:
  • Like
Likes FactChecker and WWGD
  • #15
Learning how to read and understand a Normal table takes some practice. There is software and online tools that will churn out the values for you, but if you don't understand the proper inputs to give, then you will get nonsense answers.

For online tools, I like the following. It shows a picture of what it is calculating. https://davidmlane.com/hyperstat/z_table.html
 
  • #16
scottdave said:
Learning how to read and understand a Normal table takes some practice. There is software and online tools that will churn out the values for you, but if you don't understand the proper inputs to give, then you will get nonsense answers.

For online tools, I like the following. It shows a picture of what it is calculating. https://davidmlane.com/hyperstat/z_table.html
Though symmetry about the mean of the Normal ( 0 for the Standard Normal) simplifies things quite a bit.
 
  • #17
scottdave said:
Learning how to read and understand a Normal table takes some practice. There is software and online tools that will churn out the values for you, but if you don't understand the proper inputs to give, then you will get nonsense answers.

For online tools, I like the following. It shows a picture of what it is calculating. https://davidmlane.com/hyperstat/z_table.html
Sorry, I don't really get what you were talking about, I've just learned about this topic like a week ago. I'm provided with 2 standard normal distribution tables (which use Probability density function and Cumulative distribution function) and multiple other tables (Binomial Probability Distribution, the Poisson distribution,...). Could you check if my answer is correct, thank you very much.
 

Attachments

  • 394879072_229283759939956_2078985937662566318_n.jpg
    394879072_229283759939956_2078985937662566318_n.jpg
    26 KB · Views: 39
  • #18
Seems fine. But round down the number of pigs to 527 and let us have that .9 of a pig for the homework help.
 
  • Haha
Likes berkeman
  • #19
WWGD said:
Seems fine. But round down the number of pigs to 527 and let us have that .9 of a pig for the homework help.
what do you mean? Shouldn't I round the number?
 
  • #20
Memo said:
what do you mean? Shouldn't I round the number?
Just kidding, Memo ;). Edit: No need to round down.
 
  • #21
Memo said:
I'm provided with 2 standard normal distribution tables (which use Probability density function and Cumulative distribution function)
That is all you need to answer this problem. Pay special attention to @scottdave 's post #14.

(PS. I should not have crossed out my answer in post #8. It was correct.)
 
  • #22
FactChecker said:
(PS. I should not have crossed out my answer in post #8. It was correct.)
You might still have time to add a comment in that post that mentions that it is actually correct (if not, I can do it for you). It's best not to alter older posts too much since it confuses readers later, but adding an editorial note should be fine.
 
  • Like
Likes FactChecker

1. How do you calculate the probability of a pig having 3 DYL blood?

To calculate the probability of a pig having 3 DYL blood, you would need to know the total number of pigs in the herd and the number of pigs with 3 DYL blood. The probability can be calculated by dividing the number of pigs with 3 DYL blood by the total number of pigs in the herd.

2. What is the expected number of type A pigs with 3 DYL blood in the herd?

The expected number of type A pigs with 3 DYL blood in the herd can be calculated by multiplying the probability of a pig having 3 DYL blood by the total number of pigs in the herd. This will give you an estimate of how many type A pigs are expected to have 3 DYL blood.

3. Is there a way to determine the confidence interval for the number of type A pigs with 3 DYL blood?

Yes, you can determine the confidence interval for the number of type A pigs with 3 DYL blood using statistical methods. By calculating the standard error of the estimate and the desired level of confidence, you can establish a range within which the true number of type A pigs with 3 DYL blood is likely to fall.

4. How can we test if the observed number of type A pigs with 3 DYL blood is significantly different from the expected number?

You can test if the observed number of type A pigs with 3 DYL blood is significantly different from the expected number using hypothesis testing. By comparing the observed number to the expected number and calculating a p-value, you can determine if the difference is statistically significant.

5. Are there any factors that may influence the probability of a pig having 3 DYL blood?

Yes, there may be factors that influence the probability of a pig having 3 DYL blood, such as genetic predisposition or environmental factors. Conducting further research and analysis can help identify these factors and their impact on the likelihood of a pig having 3 DYL blood.

Similar threads

Replies
1
Views
2K
  • Sci-Fi Writing and World Building
Replies
15
Views
3K
  • Biology and Chemistry Homework Help
Replies
2
Views
4K
  • Calculus and Beyond Homework Help
Replies
3
Views
2K
  • General Discussion
2
Replies
65
Views
8K
  • General Discussion
Replies
3
Views
3K
Back
Top