Up 244.14.4.26: Plotting $r^7$ Integrals

  • MHB
  • Thread starter karush
  • Start date
In summary, the conversation discusses a problem involving converting a sum of integrals to a Cartesian sum of integrals and sketching the corresponding region of integration. The problem involves evaluating integrals involving trigonometric functions and requires transforming the coordinates to Cartesian coordinates. The conversation also touches upon the use of basic identities and understanding the difference between $\theta$ and $x$ values.
  • #1
karush
Gold Member
MHB
3,269
5
$\tiny{up 244.14.4.26}$
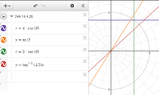
$\textit{a. Sketch the region of Intregration}$
$\textit{b. convert the sum of integrals to a Cartesian sum of Integrals:}$
\begin{align*}\displaystyle
I_{26}&=\int_{0}^{\tan^{-1}(4/3)}
\int_{0}^{3\sec{\theta}}
r^7 \, dr \, d\theta
+\int_{\tan^{-1}(4/3)}^{\pi/2}
\int_{0}^{4\csc\theta}
r^7 \, dr \, d\theta\\
&=\int_{0}^{\tan^{-1}(4/3)}\Biggr|\frac{r^8}{8}\Biggr|_0^{3\sec{\theta}} \, d\theta
+\int_{\tan^{-1}(4/3)}^{\pi/2}\Biggr|\frac{r^8}{8}\Biggr|_{0}^{4\csc\theta} \, d\theta
\end{align*}
next ?

OK first I don't how you plot $r^7$ on Desmos
 
Last edited:
Physics news on Phys.org
  • #2
karush said:
$\tiny{up 244.14.4.26}$
$\textit{a. Sketch the region of Intregration and convert the sum of integrals to a Cartesian sum of Integrals:}$
\begin{align*}\displaystyle
I_{26}&=\int_{0}^{\tan^{-1}(4/3)}
\int_{0}^{3\sec{\theta}}
r^7 \, dr \, d\theta
+\int_{\tan^{-1}(4/3)}^{\pi/2}
\int_{0}^{4\csc\theta}
r^7 \, dr \, d\theta\\
&=\int_{0}^{\tan^{-1}(4/3)}\Biggr|\frac{r^8}{8}\Biggr|_0^{3\sec{\theta}} \, d\theta
+\int_{\tan^{-1}(4/3)}^{\pi/2}\Biggr|\frac{r^8}{8}\Biggr|_{0}^{4\csc\theta} \, d\theta
\end{align*}
next ?

OK first I don't how you plot $r^7$ on Desmos

Can you plot:

1) [tex]\theta = \tan^{-1}(4/3)[/tex]

2) [tex]r = 3\cdot\sec(\theta)[/tex]

3) [tex]\theta = \pi/2[/tex]

4) [tex]r = 4\cdot\csc(\theta)[/tex]

Why are you trying to plot $r^7$? $r^6$ may be more appropriate. Why?
 
  • #3

Attachments

  • 244.14.4.26.PNG
    244.14.4.26.PNG
    24.6 KB · Views: 73
  • #4
Interesting. Why did you choose to abandon $\theta$ and insert y and x on $\theta = \pi/2$ and the inverse tangent?

$\theta = \pi/2$ is the y-axis.

Give some thought to the inverse tangent, too.

You could just substitute some version of the basic identities and rearrange a little.

$y = r\cdot\sin(\theta)$

$x = r\cdot\cos(\theta)$

$r^{2} = x^{2}+y^{2}$

$\theta = $ ?? I'll let you track down this one. :-)
 
  • #5
$\theta = \tan^{-1}(4/3)$ doesn't plot
I assume we are finding the area of a wedge?
\begin{align*}
&=\int_{0}^{\tan^{-1}(4/3)}\Biggr|\frac{r^8}{8}\Biggr|_0^{3\sec{\theta}} \, d\theta
+\int_{\tan^{-1}(4/3)}^{\pi/2}\Biggr|\frac{r^8}{8}\Biggr|_{0}^{4\csc\theta} \, d\theta \\
&=3\int_{0}^{\tan^{-1}(4/3)} r^7 \sec{\theta}\, dr
\, +
4\int_{\tan^{-1}(4/3)}^{\pi/2} r^7 \csc(\theta) dr
\end{align*}
so far :mad::mad:

 
  • #6
Are you sure you're understanding the problem statement? I don't see any instruction to EVALUATE the integrals. Just draw the pictures and transform to Cartesian Coordinates.
 
  • #7
I don't don't think my drawing is correct?
or is it?
 
  • #8
karush said:
I don't don't think my drawing is correct?
or is it?
You haven't fixed $\theta = \pi/2$
 
  • #9
tkhunny said:
You haven't fixed $\theta = \pi/2$

that expression won't plot in desmos

is the same as $x=\frac{\pi}{2}$?
 
  • #10
karush said:
that expression won't plot in desmos

is the same as $x=\frac{\pi}{2}$?

Absolutely not.
 

Related to Up 244.14.4.26: Plotting $r^7$ Integrals

1. What is the purpose of plotting $r^7$ integrals?

The purpose of plotting $r^7$ integrals is to visualize the value of the integral as a function of $r$, where $r$ represents the distance from the origin. This can provide insights into the behavior of the function and help in understanding its properties.

2. How is the $r^7$ integral calculated?

The $r^7$ integral is calculated by first setting up the integral using the formula $\int_{a}^{b} r^7 dr$, where $a$ and $b$ represent the lower and upper bounds of the integral, respectively. Then, the integral is evaluated using techniques such as integration by parts, substitution, or partial fractions.

3. What information can be obtained from plotting $r^7$ integrals?

Plotting $r^7$ integrals can provide information about the behavior of the function, such as whether it is increasing or decreasing, and its rate of change. It can also show the relationship between the integral and the distance from the origin.

4. How can plotting $r^7$ integrals be useful in scientific research?

Plotting $r^7$ integrals can be useful in scientific research as it can provide a visual representation of the function and its behavior. This can help in analyzing data, making predictions, and understanding the physical significance of the function in a particular context.

5. Are there any limitations to plotting $r^7$ integrals?

One limitation of plotting $r^7$ integrals is that it only provides information about the function at specific values of $r$. It does not give a complete picture of the behavior of the function. Additionally, the accuracy of the plot may be affected by the chosen bounds of the integral and the method used for evaluation.

Similar threads

Replies
4
Views
440
  • Calculus
Replies
29
Views
804
Replies
2
Views
349
Replies
14
Views
3K
Replies
14
Views
2K
Replies
4
Views
1K
  • Calculus
Replies
12
Views
2K
  • Calculus
Replies
5
Views
2K
Replies
1
Views
1K
Replies
20
Views
2K
Back
Top