djymndl07
- 24
- 1
Look at the following Image.
The results are okay but clearly the plot colors does not match with the color bar. for example the color bar is showing only single color. the value 0.4 in color bar corresponds to the radius 0.8 which is different color in the plot.
Another issue is that I don't know why that blue horizontal line is there at one side of the center. That should not be there.
I am using the following code-
f[r_] := 1 - (2*M)/r + Q^2/r^2 + (8/3)*Pi*P*r^2
mass = (3*Q^2 + 3*r^2 + 8*P*Pi*r^4)/(6*r) /. r -> rh;
T[r_] := (-Q^2 + r^2 + 8*P*Pi*r^4)/(4*Pi*r^3)
veff[r_] := f[r]/r^2
rp = r /. Last[NSolve[D[veff[r], r] == 0, r, Reals]] /. M -> mass
rs = rp/Sqrt[f[rp]] /. M -> 0.9;
Q = 0.1;
P = 0.3315;
plot = ParametricPlot[{rs*Cos[\[Theta]], rs*Sin[\[Theta]]}, {rh, 0.37, 0.6}, {\[Theta],
0, 2*Pi}, Axes -> False, ColorFunctionScaling -> False,
ColorFunction -> Function[{x, y, rh}, ColorData["SunsetColors"][Rescale[T[rh],
{T[0.37],T[0.6]}]]],
PlotLegends -> BarLegend[{"SunsetColors", {T[0.37], T[0.6]}}, LegendLabel ->
Style[HoldForm[T], 14]]]
Can anyone help me? Thanks in advance.
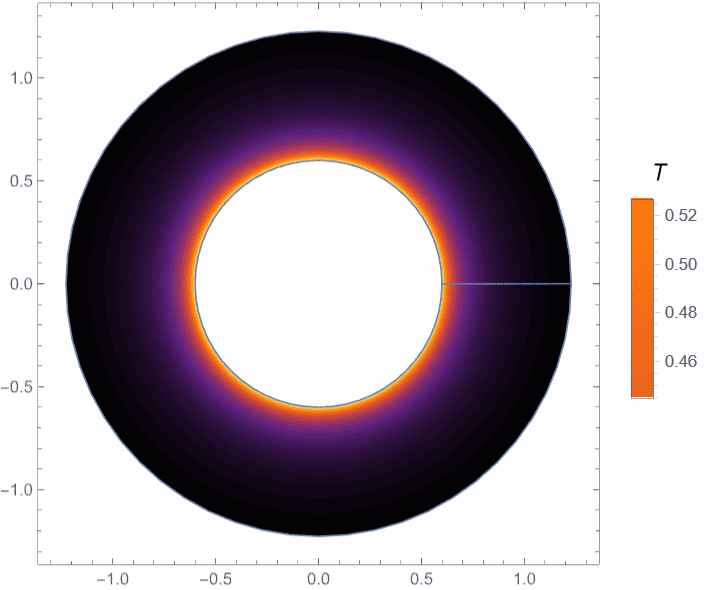
The results are okay but clearly the plot colors does not match with the color bar. for example the color bar is showing only single color. the value 0.4 in color bar corresponds to the radius 0.8 which is different color in the plot.
Another issue is that I don't know why that blue horizontal line is there at one side of the center. That should not be there.
I am using the following code-
f[r_] := 1 - (2*M)/r + Q^2/r^2 + (8/3)*Pi*P*r^2
mass = (3*Q^2 + 3*r^2 + 8*P*Pi*r^4)/(6*r) /. r -> rh;
T[r_] := (-Q^2 + r^2 + 8*P*Pi*r^4)/(4*Pi*r^3)
veff[r_] := f[r]/r^2
rp = r /. Last[NSolve[D[veff[r], r] == 0, r, Reals]] /. M -> mass
rs = rp/Sqrt[f[rp]] /. M -> 0.9;
Q = 0.1;
P = 0.3315;
plot = ParametricPlot[{rs*Cos[\[Theta]], rs*Sin[\[Theta]]}, {rh, 0.37, 0.6}, {\[Theta],
0, 2*Pi}, Axes -> False, ColorFunctionScaling -> False,
ColorFunction -> Function[{x, y, rh}, ColorData["SunsetColors"][Rescale[T[rh],
{T[0.37],T[0.6]}]]],
PlotLegends -> BarLegend[{"SunsetColors", {T[0.37], T[0.6]}}, LegendLabel ->
Style[HoldForm[T], 14]]]
Can anyone help me? Thanks in advance.
Last edited: