Comparing Near-Infrared Spectra: What Stat Method?

AI Thread Summary
To compare near-infrared spectra ranging from 600 nm to 1100 nm, it's crucial to define the comparison's purpose, which is to assess the similarity in the shape of the spectra. Normalizing the curves to a specific wavelength region of interest is recommended, followed by calculating the root mean square (RMS) summed deviation for a quantitative comparison. While Pearson correlation is typically used for linear relationships, it can still provide valuable insights in this context, especially when high absorbance in one spectrum corresponds to high absorbance in another. It is also suggested to explore shape similarity metrics and consider statistical tests like the t-test to determine if differences in shapes are significant. Additionally, fitting the spectra to a model can yield parameters for further comparison. Visualizing the data through scatterplots can help clarify the relationship between the spectra.
groot44
Messages
6
Reaction score
2
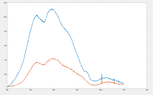
I'd like to compare 2 or more near-infrared spectra. The data consists of measured light intensity in different wavelengths (range 600 nm to 1100 nm).

I'm wondering which statistical method would be appropriate? I noticed when searching online that pearson correlation might be inaccurate as it's used for linear correlation. However, when experimenting with MATLAB's function corrcoef, I get pretty accurate results when comparing visually spectra. But still unsure if some other method would be better in this case so thoughts on the matter would be highly appreciated, thanks!

Attached example of the data to be compared.
 

Attachments

  • Screenshot 2021-09-17 at 10.45.11.png
    Screenshot 2021-09-17 at 10.45.11.png
    7.8 KB · Views: 152
Biology news on Phys.org
groot44 said:
I'd like to compare 2 or more near-infrared spectra.
What do you mean by "compare" in this context? What would the comparison say about the signals?
 
Dale said:
What do you mean by "compare" in this context? What would the comparison say about the signals?

Good question. I’d like to compare the shape of spectra. Comparison would say in this context how similar the shapes of the spectra are.
 
I assume each spectrum is background subtracted when taken.
My first attempt would be to narrowly as possible define the wavelength region of interest and normalize each curve to that region. Look at the results. If you want a single number for compare, the RMS summed deviation is then convenient. How clever do you need to be?
 
groot44 said:
Good question. I’d like to compare the shape of spectra. Comparison would say in this context how similar the shapes of the spectra are.
I don't know too much about shape metrics. Here is a paper about shape similarity measures:

https://citeseerx.ist.psu.edu/viewd...measure between,parts of both compared shapes.

Once you have computed the appropriate shape metric then you could do a standard statistical measurement like the t-test to see if the difference in shapes according to these metrics is significantly different from zero.

Alternatively, if you have some model of the shape of the spectra then you could fit each spectrum to the model and get some confidence intervals for the parameters. Then you could check for similarity by comparing the parameters.
 
  • Like
Likes jim mcnamara and hutchphd
groot44 said:
I'm wondering which statistical method would be appropriate? I noticed when searching online that pearson correlation might be inaccurate as it's used for linear correlation.
In your data, you expect to see a linear correlation between the spectra of the two compounds. For wavelengths, where you see high absorbance for the first compound, you expect to see high absorbance for the second compound and vice versa for wavelengths were you see low absorbance for the first compound. The absorbance is not linearly correlated with wavelength, but that doesn't matter as you're measuring the correlation between the absorbance of two compounds. (Nevertheless, whenever calculating the correlation coefficient, it's always helpful to make a scatterplot of the data to see whether the relationship is linear or more complicated).
 
  • Like
Likes jim mcnamara
Deadly cattle screwworm parasite found in US patient. What to know. https://www.usatoday.com/story/news/health/2025/08/25/new-world-screwworm-human-case/85813010007/ Exclusive: U.S. confirms nation's first travel-associated human screwworm case connected to Central American outbreak https://www.reuters.com/business/environment/us-confirms-nations-first-travel-associated-human-screwworm-case-connected-2025-08-25/...
Chagas disease, long considered only a threat abroad, is established in California and the Southern U.S. According to articles in the Los Angeles Times, "Chagas disease, long considered only a threat abroad, is established in California and the Southern U.S.", and "Kissing bugs bring deadly disease to California". LA Times requires a subscription. Related article -...
I am reading Nicholas Wade's book A Troublesome Inheritance. Please let's not make this thread a critique about the merits or demerits of the book. This thread is my attempt to understanding the evidence that Natural Selection in the human genome was recent and regional. On Page 103 of A Troublesome Inheritance, Wade writes the following: "The regional nature of selection was first made evident in a genomewide scan undertaken by Jonathan Pritchard, a population geneticist at the...
Back
Top