Display information on a normal curve

Join the discussion
Registration is free. Ask a follow-up in this thread, or start your own.
1 reply · 3K views
CosmoK123456
Messages
4
Reaction score
0
A hospital would like to determine the average stay for its patients having abdominal surgery. A sample of 15 patients revealed a sample mean of 6.4 days and a sample standard deviation of 1.4 days.How do you display this in a normal curve?? any help would be appreciated. Thanks
 
Last edited:
Physics news on Phys.org
CosmoK123456 said:
A hospital would like to determine the average stay for its patients having abdominal surgery. A sample of 15 patients revealed a sample mean of 6.4 days and a sample standard deviation of 1.4 days.How do you display this in a normal curve?? any help would be appreciated. Thanks

Hi CosmoK! :)

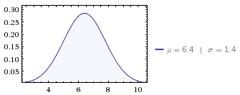
The normal curve looks like this:
View attachment 1198

It has a mean of 6.4 days and a standard deviation of 1.4 days.
 

Attachments

  • normal_curve_64.png
    normal_curve_64.png
    1.7 KB · Views: 120