Explain friction in a pulley system

13 replies · 9K views · last reply
KatrineRav
Messages
13
Reaction score
1
Hi!

I'm working in a new area and I'm looking for inputs/suggestions for relevant factors to look into and possible ressource where I can read about this :)

I did some tests in a pulley similar to the one below.
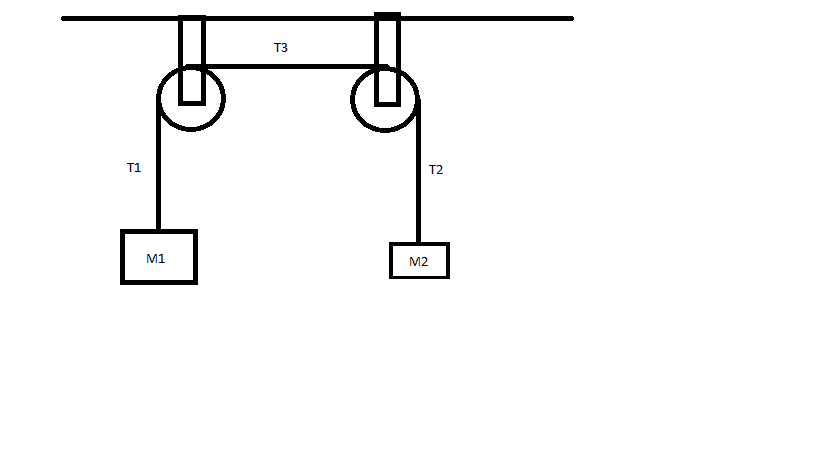
Free-body style diagram of two pulleys hung from a horizontal beam, with a rope T3 joining them; mass M1 hangs on the left from tension T1 and mass M2 on the right from tension T2.

I had a fixed weight at M2. I started with M1=M2 but added weights to M1 until the weights started moving (M1 down and M2 up). I believe my measurements can be used to say something about static friction in the system.

I am now trying to explain why M1 has to be quite a bit heavier than M2 for the system to start moving.
I know the following:
- there is friction between rope and pulley. The static friction keeps the rope from slipping over the surface and makes the pulley rotate when the rope is pulled. I don't think this is relevant since it does not oppose the movement of M1 and M2.
- there is friction between the pulley and the axle. I believe this results in a torque opposing the movement. I believe this is the factor I'm interested in.

Homework Statement


PROBLEM STATEMENT
Not totally sure! Something like "Quantify the forces opposing movement in the pulley system and explain why M1 has to be (quite a bit) larger than M2 before the system starts moving)

DATA
This is my dataset. Masses are measured in kg.
m2 m1
23,9 31,8
34 42,7
43,4 51,32. + 3. Relevant equations + attempt at a solution
I'm not totally sure.

WORK EFFICIENCY
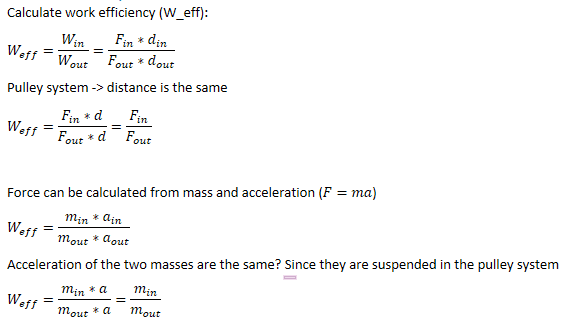
Handwritten-style typed derivation of work efficiency: W_eff = W_in/W_out = (F_in*d_in)/(F_out*d_out), then for a pulley with equal distance W_eff = F_in/F_out, then with F = ma W_eff = (m_in*a_in)/(m_out*a_out), then with equal accelerations W_eff = m_in/m_out.

I could say that the loss might be due to friction in

FRICTION
I'm not sure whether I should look into static friction on a surface or belt friction

Final remarks
I've been researching the problem for a few hours, but I simply can't figure out where to start! I hope you can point me in the right direction! :)
 
Attachments
  • Handwritten-style typed derivation of work efficiency: W_eff = W_in/W_out = (F_in*d_in)/(F_out*d_out), then for a pulley with equal distance W_eff = F_in/F_out, then with F = ma W_eff = (m_in*a_in)/(m_out*a_out), then with equal accelerations W_eff = m_in/m_out.
    upload_2019-3-14_15-13-59.png
    7.6 KB · Views: 881
  • Free-body style diagram of two pulleys hung from a horizontal beam, with a rope T3 joining them; mass M1 hangs on the left from tension T1 and mass M2 on the right from tension T2.
    vEgJU.png
    1.6 KB · Views: 1,460
  • Like
Likes   Reactions: berkeman
Welcome to the PF. :smile:
KatrineRav said:
- there is friction between the pulley and the axle. I believe this results in a torque opposing the movement. I believe this is the factor I'm interested in.
Yes, this is the friction that opposes the initial rotational movement.

The rope exerts torque on the pulleys. That torque on each pulley needs to be enough to overcome the frictional bearing/axle torque. Note that the two forces (rope force and friction force) are exerted at different radii on each pulley.
 
KatrineRav said:
This is my dataset. Masses are measured in kg.
m2 m1
23,9 31,8
34 42,7
43,4 51,3
Net 7.9 kg delta for the first test.
Net 8.7 kg delta for the second test
Net 7.9 kg delta for the third test.

It is not a lot of data to go on, but suggests a pattern for other pairs of weights. That pattern tends to rule out one obvious friction model.
 
What friction model would you suggest? How would you calculate it?

I'm all right with the data not fitting the model. They are probably pretty inaccurate. It was pretty difficult to find the exact point where the system started moving :)
 
The classic friction model is that friction is proportional to normal force. The data do not support that here. If you were to create a trend line for that data set of three points, what trend line would you pick?
 
jbriggs444 said:
Net 7.9 kg delta for the first test.
Net 8.7 kg delta for the second test
Net 7.9 kg delta for the third test.
@KatrineRav -- How "sticky" did the pulleys feel when you rotated them slowly by hand? I can see a small increase in axle friction with overall weight loading, but your 3rd piece of data does not follow that trend. Were they old pulleys that had not been used in a while?
 
  • Like
Likes   Reactions: jbriggs444
jbriggs444 said:
The classic friction model is that friction is proportional to normal force. The data do not support that here. If you were to create a trend line for that data set of three points, what trend line would you pick?
I guess the trendline with the best fit would be a parabola, so a 2nd order polynomial. But right now I'm inclined to completely disregard my data set, since my measurements are properly very inaccurate and only contains very few data points. I think I would rather look at it from a theoretical angle and explain what I would expect my dataset to look like :)
 
berkeman said:
@KatrineRav -- How "sticky" did the pulleys feel when you rotated them slowly by hand? I can see a small increase in axle friction with overall weight loading, but your 3rd piece of data does not follow that trend. Were they old pulleys that had not been used in a while?
Unfortunately I did not try to rotate them by hand!
 
KatrineRav said:
But right now I'm inclined to completely disregard my data set
Can you re-take the data? If so, warm up the pulleys a bit by rotating them a few times before each trial. If they are sticky, hopefully that will smooth them out some.
 
berkeman said:
Can you re-take the data? If so, warm up the pulleys a bit by rotating them a few times before each trial. If they are sticky, hopefully that will smooth them out some.

No, unfortunately not. I took down the test setup and I don't have access to the pulleys. This test is a part of a much bigger setup. I just did the test to try to quantify the friction, but it's all right if I'm not able to do that. It's not the main objective of my project :)
 
Well, you may be able to suggest in your report why you think the 3rd data point appeared to show lower bearing friction than the previous two datapoints. What would that hypothesis be? :smile:

There were at least a couple times in my undergrad labs (physics and EE) where I got data that went against what I expected from the theory, and my TAs asked me to explain likely causes for the mismatches. I was usually able to figure out what I did wrong (or did not account for) in my test setups, which resulted in good marks anyway on the lab.
 
Can I apply this formula to this situation?
Equation F_s = μ_s N with labels: F_s is the force of static friction, μ_s is the coefficient of static friction, and N is the normal force.


I guess the normal force (F_N on my drawing) in this situation would be F_N=mg+Mg
Free-body style sketch of an Atwood machine: a pulley hung from a ceiling, with a red arrow labeled F_N pointing up from the axle, and masses M (larger) and m (smaller) hanging from either side of the rope.


But I guess this only applies to the friction between the rope and the pulley. I can't see how to calculate the friction between the axle and the pulley. But I guess I would have to look a torques rather than force.
 
Attachments
  • Free-body style sketch of an Atwood machine: a pulley hung from a ceiling, with a red arrow labeled F_N pointing up from the axle, and masses M (larger) and m (smaller) hanging from either side of the rope.
    upload_2019-3-14_16-54-29.png
    10.4 KB · Views: 998
  • Equation F_s = μ_s N with labels: F_s is the force of static friction, μ_s is the coefficient of static friction, and N is the normal force.
    upload_2019-3-14_16-54-53.png
    43.7 KB · Views: 813
berkeman said:
Well, you may be able to suggest in your report why you think the 3rd data point appeared to show lower bearing friction than the previous two datapoints. What would that hypothesis be? :smile:

There were at least a couple times in my undergrad labs (physics and EE) where I got data that went against what I expected from the theory, and my TAs asked me to explain likely causes for the mismatches. I was usually able to figure out what I did wrong (or did not account for) in my test setups, which resulted in good marks anyway on the lab.

My hypothesis is that it is due to errors in determining the mass of M1. I was trying to balance a huge rope sack on a small scale. I supported that sack while it was weighed and I might have lifted it slightly. It is also possible that some of the sack was standing on the floor and therefore supported by the floor so the scale was unloaded. The weight distribution on the scale was also not centered, which might have led to an error. And I used my cheap bathroom scale - not the most accurate!
 
I got to go now - thanks for the help! I would love some suggestions for how to calculate the friction in the bearing / between the axle and the pulley :)
Looking forward to looking into it tomorrow :)