Smushiehippo
- 10
- 0
- Homework Statement
- 1) Explain where the first point of failure is likely to originate, and why.
2) An analysis of the studies, do you think that they will be an accurate representation of what will
happen in practice? how would you improve it.
- Relevant Equations
- none
Hey
Im doing FEA and got stuck on question. The diagram go me stuck, because looking through the workbook it says high stresses are in red and low in blue, whereas they included both different kind of stresses on the same diagram and no data.
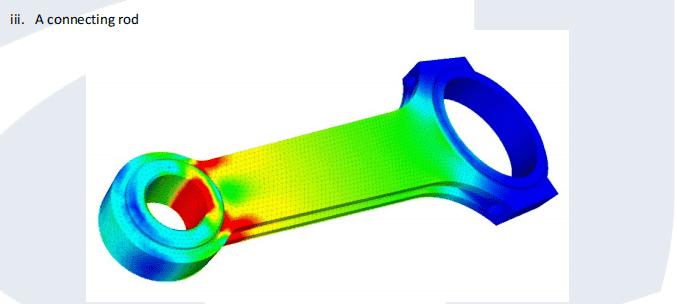
Note: High Compressive strains are noted by blue, high tensile strains are noted in red, low strains are noted as light
blue/green/yellow.
What I Put
I think first point of failure would be located at the small end, where there is high tensile stress. the high tensile stress would cause deformation and fatigue fractures leading to failure.
For part 2 of the question - I layed out how FEA works, what the accuracy of the data depended on. i stated different methrod of checking (check with other collugues, past results, rerun simulations).
I believe comparing this result with past results ran the diagrams show a high level of accuracy, but cannot be 100% certain of accuracy. I do believe areas on the diagram may give errors in results, big end due to zero radius omitting tensiles stress. Ways to improve to include data on the stress to see if it exceeds yeild stress and put different stress on different diagrams.
cheers for reading
Im doing FEA and got stuck on question. The diagram go me stuck, because looking through the workbook it says high stresses are in red and low in blue, whereas they included both different kind of stresses on the same diagram and no data.
Note: High Compressive strains are noted by blue, high tensile strains are noted in red, low strains are noted as light
blue/green/yellow.
What I Put
I think first point of failure would be located at the small end, where there is high tensile stress. the high tensile stress would cause deformation and fatigue fractures leading to failure.
For part 2 of the question - I layed out how FEA works, what the accuracy of the data depended on. i stated different methrod of checking (check with other collugues, past results, rerun simulations).
I believe comparing this result with past results ran the diagrams show a high level of accuracy, but cannot be 100% certain of accuracy. I do believe areas on the diagram may give errors in results, big end due to zero radius omitting tensiles stress. Ways to improve to include data on the stress to see if it exceeds yeild stress and put different stress on different diagrams.
cheers for reading