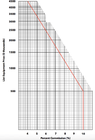
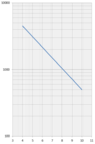
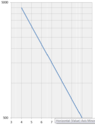
MHB Finding equation from logarithmic graph

  • Thread starter Thread starter dsm7272
  • Start date Start date
  • Tags Tags
    Graph Logarithmic
dsm7272
Messages
3
Reaction score
0
I've spent some time researching and trying to find an equation for this line, but it's not exact. I'm only searching for the equation of the line that descends towards zero (the angled line). I plugged in some numbers and it does not match the graph, the line on the graph is steeper. I start with y=a*b^x, solve for a and b then solve to show what x equals (commission). I followed some log rules and end up with the equation you see below in the image.

Can anyone help me find the equation?View attachment 7643

View attachment 7644
 

Attachments

  • Screen Shot 2017-12-22 at 4.07.13 PM.png
    Screen Shot 2017-12-22 at 4.07.13 PM.png
    47.8 KB · Views: 111
  • Screen Shot 2017-12-22 at 4.12.17 PM.png
    Screen Shot 2017-12-22 at 4.12.17 PM.png
    6.4 KB · Views: 122
Mathematics news on Phys.org
It seems you are making this more complicated than it needs to be - the line is straight - so a linear model should be sufficient. Can you find a linear equation that represents the line?
 
greg1313 said:
It seems you are making this more complicated than it needs to be - the line is straight - so a linear model should be sufficient. Can you find a linear equation that represents the line?

I think the y-axis is intended to be a logarithmic scale. Is the y-axis number scale wrong? Is that the problem?
The line was placed on some generic log scale graph, then a line was drawn.
 
Hi dsm7272,

It's pretty hard (if not impossible) for me to tell what logarithmic scale is being used and I think that information is crucial. Do you have any more information about the graph?
 
dsm7272 said:
I think the y-axis is intended to be a logarithmic scale. Is the y-axis number scale wrong? Is that the problem?
The line was placed on some generic log scale graph, then a line was drawn.

Hi dsm7272! Welcome to MHB! (Smile)

If I try to find the slope of the line segment with end points at prices 500 and 4500, I get $\frac{10\%-4\%}{\log(500) - \log(4500)} = -0.0628771$.
And from the formula the slope should be $\dfrac{1}{\log\sqrt[0.06]{\frac 19}} = -0.0628771$.
So that is a match.
 
I like Serena said:
Hi dsm7272! Welcome to MHB! (Smile)

If I try to find the slope of the line segment with end points at prices 500 and 4500, I get $\frac{10\%-4\%}{\log(500) - \log(4500)} = -0.0628771$.
And from the formula the slope should be $\dfrac{1}{\log\sqrt[0.06]{\frac 19}} = -0.0628771$.
So that is a match.
Thank you. Are you saying my equation is correct? Because when I go to plug in 1,500 as the price I get 7% commission. But, on the graph it's more like 7.4%. and that's where I'm confused. Maybe the scale of the graph is off?
 
dsm7272 said:
Thank you. Are you saying my equation is correct? Because when I go to plug in 1,500 as the price I get 7% commission. But, on the graph it's more like 7.4%. and that's where I'm confused. Maybe the scale of the graph is off?

Indeed!
The numbers have been placed wrong on the graph paper.
The graph should look like:
View attachment 7645

If I'm not mistaken, it could be fixed by putting all prices one line down.
That is, the 500 should be at the bottom. And 5000 should be at the top.
That is:
View attachment 7646
 

Attachments

  • Price_Commission_LogPlot.png
    Price_Commission_LogPlot.png
    3.1 KB · Views: 101
  • Price_Commission_LogPlot2.png
    Price_Commission_LogPlot2.png
    5 KB · Views: 109
Back
Top