Forcing the best fit line to pass through a certain point (Octave)

Join the discussion
Ask a follow-up here, or get your own question answered by working scientists, mathematicians and engineers — people, not an autocomplete.
Real named experts · corrections over time · the nuance an AI answer skips
12 replies · 7K views
Messages
2,188
Reaction score
2,694
I have the following code in Octave:
Matlab:
h = [29.3 25.3 19.7 16.0 10.9];
v = [0.53 0.47 0.37 0.29 0.21];
plot(h,v,'obk')
hold on
p = polyfit(h,v,1);
y = polyval(p,h);
plot(h,y,'-bk')
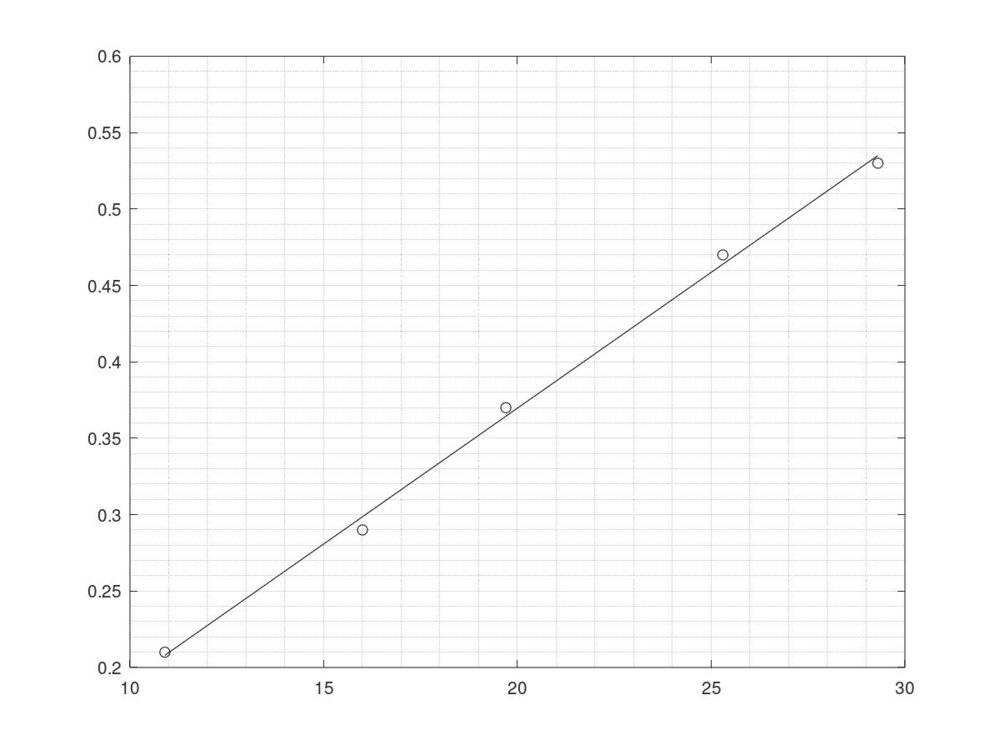
And I get a good graph:
viscosity.jpg


I can extrapolate the best fit line using the following code:
Matlab:
x = -1:0.01:11;
>> y = polyval(p,x);
>> plot(x,y,'--r')
and if I zoom on the graph, I get this:
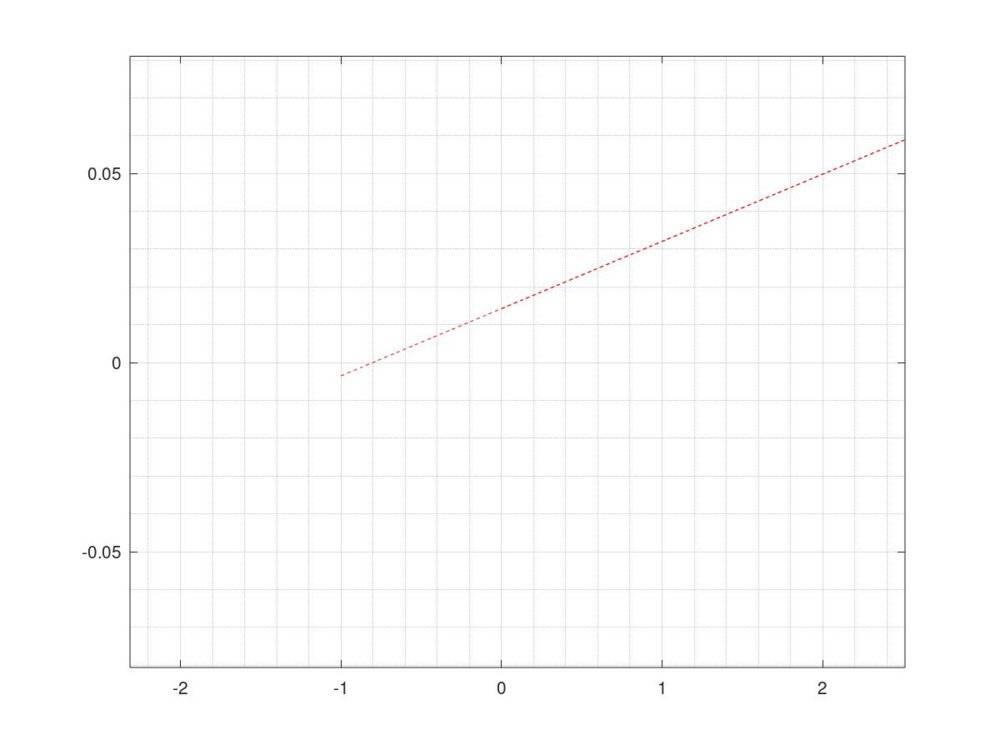
extrapolated.jpg

Evidently, the line doesn't pass through (0,0).

But I have to make it pass through the Origin. In that case, it will no longer be the best fit line, but nevertheless it will serve my purpose.

Any idea on how to do this?
 
on Phys.org
  • Like
Likes   Reactions: Wrichik Basu
Wrichik Basu said:
Evidently, the line doesn't pass through (0,0).

But I have to make it pass through the Origin. In that case, it will no longer be the best fit line, but nevertheless it will serve my purpose.

Any idea on how to do this?

Yes. You're fitting a different model. Instead of ##y = mx + b## you want to fit ##y = mx##. I don't know if you can do it with polyfit(), but the math is pretty simple.

Minimize the square error E
##E = \sum_i (y - y_i)^2 = \sum_i (mx_i - y_i)^2 = \sum_i m^2 x_i^2 - 2 \sum_i mx_i y_i + \sum_i y_i^2##

##dE/dm = 0 \\
\Rightarrow 2m \sum_i x_i^2 - 2\sum_i x_i y_i = 0 \\
\Rightarrow m = (\sum_i x_i y_i )/ (\sum_i x_i^2)##

That is the best fit value of ##m## for the model ##y = mx##, and you should interpolate / extrapolate using that model.
 
  • Like
Likes   Reactions: Wrichik Basu
jedishrfu said:
You could add 0,0 to your collection of points.
That would draw the line toward (0,0). You may need to add it many times to get it as close as you want and then all the statistical calculations would be messed up.
 
  • Like
Likes   Reactions: Wrichik Basu and jedishrfu
FactChecker said:
That would draw the line toward (0,0). You may need to add it many times to get it as close as you want and then all the statistical calculations would be messed up.

Sometimes cheap solutions work but not as well as one would like that’s why they’re cheap.

Octave apparently doesn’t have the fitlm() function but does have some linear regression methods.

https://octave.sourceforge.io/optim/function/LinearRegression.html
 
jedishrfu said:
Sometimes cheap solutions work but not as well as one would like that’s why they’re cheap.
Absolutely, I don't expect any better. How much can one provide for free? There are some major differences between Matlab and Octave. For example, for symbolic math, Octave depends on SymPy, while Matlab was created much before Python.
 
  • Like
Likes   Reactions: jedishrfu
I sometimes use freemat when I need to compute a quick plot. It has much of the core Matlab functionality and is easy to install.

More recently, Julia from MIT has come online to challenge Matlab in performance. Much of its syntax is similar to Matlab with notable differences in how arrays are referenced ie parens in Matlab vs square brackets in Julia. Many folks are extending the Julia ecosystem with new packages on github everyday. It’s main weakness is its IDE which is cobbled together using Juno or using Jupyter notebooks. The notebooks are preferred over the IDE but Matlab users have a great IDE that’s hard to give up.
 
  • Like
Likes   Reactions: Wrichik Basu
In general forcing a regression line to go through the origin is not a good idea -- it renders the traditional correlation and r^2 values meaningless, for example. You should only do it if you have a valid reason (theoretical or other) do do so.
 
  • Like
Likes   Reactions: jedishrfu
statdad said:
In general forcing a regression line to go through the origin is not a good idea -- it renders the traditional correlation and r^2 values meaningless, for example. You should only do it if you have a valid reason (theoretical or other) do do so.
I know that. I do it only when I am forced to plot a graph of ##y=mx## rather than ##y=mx+c## because of the nature of the underlying equation.
 
  • Like
Likes   Reactions: jedishrfu