So, what data does Weather Underground give you...and by the way, where exactly did you get it, because I've only seen month-to-month spreadsheets on their website?
I use TMY3 data from NREL:
http://rredc.nrel.gov/solar/old_data/nsrdb/1991-2005/tmy3/by_state_and_city.html
TMY stands for "typical meteorological year" - it's really what you want; what is typical, not just what the last 3 years were like.
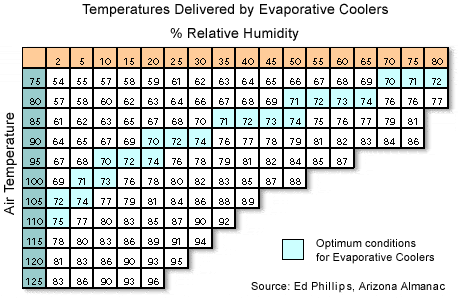
Now, as it turns out, the calculation you are asking about is pretty involved and I haven't even found a good calculation for it, even though I would use it every day if I had one (I use a chart). But there are other ways to do this...
First, why are you trying to analyze 3 years' worth of data. Don't you really want a worst-case?
Evaporative coolers work by exchanging energy between sensible (what a thermometer reads) and latent (energy from evaporating water) heat. There is a measure that combines the two to find the total energy of the air. It's called "wet bulb" temperature and as you might expect, it is very similar to what an evaporative cooler does: it puts a wet "sock" on the bulb of a thermometer and finds the resulting temperature due to evaporation.
A good, professional weather site lists the wet bulb temperature. TMY3 data includes it -- not sure if weatherunderground does. But all you need to do - with either - is put the data into a spreadsheet and sort by wet bulb temperature. The highest wet bulb temperature you see is, thermodynamically, the hottest day of the year.
Now, an evaporative cooler is probably rated to come close to providing air at the wet bulb temperature, but not exactly, since it isn't perfectly efficient/effective. It looks to me like they assume 75% effectiveness, which means you get 75% of the way from the dry bulb to the wet bulb temperature. Meaning, if the dry bulb is 90 and the wet bulb is 50, you'd get 60F off your evaporative cooler (3/4 of the 40F difference).
I think the chart assumed the airflow is perfectly matched to the room size.
No, all it says is what the temperature of the air out of the evaporative cooler is: it doesn't say what that can do for a room.