Formula to use instead of model

  • Context: MHB 
  • Thread starter Thread starter BTH
  • Start date Start date
  • Tags Tags
    Formula Model
Click For Summary
SUMMARY

The discussion focuses on calculating the expected number of tests administered to subjects in a study over time without relying on complex modeling. The suggested approach emphasizes using a straightforward formula to sum the number of tests per month based on the average enrollment of 5 subjects, each participating for 3 months. The use of spreadsheet tools is recommended to streamline the calculations, particularly when scaling to larger studies with varying subject enrollment durations.

PREREQUISITES
  • Basic understanding of statistical concepts related to study design
  • Familiarity with spreadsheet software such as Microsoft Excel or Google Sheets
  • Knowledge of formulas for summation and averages
  • Understanding of enrollment dynamics in clinical studies
NEXT STEPS
  • Research formulas for calculating expected values in clinical trials
  • Learn advanced spreadsheet techniques for dynamic data analysis
  • Explore statistical software options for managing larger datasets
  • Investigate methods for modeling subject enrollment and dropout rates
USEFUL FOR

Researchers, clinical trial coordinators, and data analysts involved in study design and management who seek efficient methods for calculating expected outcomes in longitudinal studies.

BTH
Messages
2
Reaction score
0
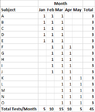
Scenario: An average of 5 test subjects are brought into a study in subsequent months and are administered 1 monthly test for as long as they remain part of the study. The time they remain in the study is 3 months.

Could someone please explain a formula or technique to sum the number of expected tests per month and total if possible in lieu of having to model it out like below to capture the dynamic of subjects rolling on and off over time? My real example has many more subjects and time on study varies, so a formula would save a lot of time at scale.

View attachment 7679
 

Attachments

  • Test cascade.PNG
    Test cascade.PNG
    3 KB · Views: 123
Physics news on Phys.org
I don't think there's anything that's going to make this more convenient than counting the number of users enrolled during a particular month. Using a spreadsheet will speed things up somewhat.
 

Similar threads

  • · Replies 1 ·
Replies
1
Views
2K
  • · Replies 45 ·
2
Replies
45
Views
6K
  • · Replies 3 ·
Replies
3
Views
3K
Replies
1
Views
1K
  • · Replies 1 ·
Replies
1
Views
2K
  • · Replies 18 ·
Replies
18
Views
3K
Replies
1
Views
1K
  • · Replies 62 ·
3
Replies
62
Views
11K
  • · Replies 6 ·
Replies
6
Views
2K