Jaccobtw
- 167
- 32
- Homework Statement
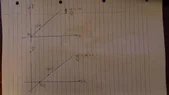
- How is x-vt a rightward moving wave?
- Relevant Equations
- f(x-vt) = disturbance
The only way I can see x-vt being a rightward moving wave is if x-vt = some position the wave had initially. As t increases, x-vt gets smaller, despite the fact that it is a rightward moving wave. For example, if x = 10 m and v = 1 m/s, as t increases, x-vt describes a position the wave had in the past. Is this correct intuition?