Discussion Overview
The discussion revolves around finding a mathematical function that represents a "wavy circle" on a graph. Participants explore various approaches, including modifications of existing functions and the use of polar coordinates, while also sharing challenges related to graphing and uploading images.
Discussion Character
- Exploratory
- Technical explanation
- Debate/contested
- Homework-related
Main Points Raised
- One participant suggests the function $x + \sin x$ as a wavey line and seeks a function that resembles a wavey circle, proposing $\sqrt{r^2 - x^2} + \sin x$ but finds it unsatisfactory.
- Another participant proposes $\sqrt{30 - x^2} + \frac{(\sin x)^2}{4}$ as a potential solution, noting that it can be adjusted by manipulating $\sin(x)$.
- A participant expresses a desire for more visible oscillations on the circle, indicating a general interest in the topic.
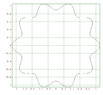
- Polar coordinates are suggested as a useful approach, with an example function $r = 1 + 0.1\sin(10\theta)$ provided.
- Several posts focus on difficulties with uploading graphs, with one participant seeking help to delete existing uploads to share their graph.
- Another participant shares a code snippet for plotting a wavy circle using parametric equations, indicating a practical approach to visualizing the concept.
- A later post reiterates the function $f(x) = \sqrt{30 - x^2} + \frac{\sin(x^2)}{4}$, although it contains a typographical error in the sine term.
Areas of Agreement / Disagreement
Participants present multiple competing views and approaches to creating a wavy circle function, with no consensus reached on a definitive solution.
Contextual Notes
Some mathematical expressions contain typographical errors, and there are unresolved issues regarding the effectiveness of proposed functions and the challenges of graphing them.
Who May Find This Useful
This discussion may be of interest to individuals exploring mathematical modeling, graphing techniques, or those seeking to understand oscillatory functions in a visual context.