Jacobian of the transformation T:x=u, y=uv

Click For Summary
SUMMARY

The discussion focuses on graphing the transformation T defined by the equations u = x and v = y in Desmos. Users are guided to graph the lines u = 1 and u = 2, as well as the hyperbolas defined by uv = 1 and uv = 2. The correct approach involves substituting u with x and v with y, leading to the functions x = 1, x = 2, y = 1/x, and y = 2/x. The axes are limited to the range of 0 to 3 for optimal visualization.

PREREQUISITES
  • Understanding of graphing functions in Desmos
  • Familiarity with the concept of transformations in mathematics
  • Knowledge of hyperbolas and their equations
  • Basic algebraic manipulation skills
NEXT STEPS
  • Learn how to graph parametric equations in Desmos
  • Explore the properties of hyperbolas and their applications
  • Investigate the use of transformations in coordinate geometry
  • Practice solving equations involving multiple variables
USEFUL FOR

Students, educators, and anyone interested in visualizing mathematical transformations and hyperbolas using Desmos.

karush
Gold Member
MHB
Messages
3,240
Reaction score
5
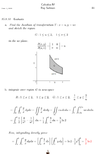
View attachment 8171

how do you graph this in Desmos ?

Assume the rest of the calculation is correct

much thank you ahead...:cool:
 
Physics news on Phys.org
Do you mean how to use Desmos to graph u= 1, u= 2, uv= 1, and uv= 2?

First, of course, Desmos graphs either y= f(x) or x= g(y) so you have to replace u with x and v with y and solve xy= 1 and xy= 2 for y (or x). that is, enter the functions x= 1, x= 2, y= 1/x, and y= 2/x. I limited the axes to that x and y were between 0 and 3 to get a good graph.
 
Country Boy said:
Do you mean how to use Desmos to graph u= 1, u= 2, uv= 1, and uv= 2?

First, of course, Desmos graphs either y= f(x) or x= g(y) so you have to replace u with x and v with y and solve xy= 1 and xy= 2 for y (or x). that is, enter the functions x= 1, x= 2, y= 1/x, and y= 2/x. I limited the axes to that x and y were between 0 and 3 to get a good graph.

View attachment 8176

ok here is my eventual typeset

desmos plot is here

https://www.desmos.com/calculator/cmqpsbp85y
 

Attachments

  • 15.8.10s.PNG
    15.8.10s.PNG
    13.3 KB · Views: 151

Similar threads

  • · Replies 3 ·
Replies
3
Views
2K
  • · Replies 2 ·
Replies
2
Views
2K
Replies
1
Views
2K
  • · Replies 5 ·
Replies
5
Views
2K
  • · Replies 2 ·
Replies
2
Views
2K
  • · Replies 3 ·
Replies
3
Views
2K
  • · Replies 3 ·
Replies
3
Views
3K
  • · Replies 4 ·
Replies
4
Views
11K
  • · Replies 1 ·
Replies
1
Views
3K
  • · Replies 30 ·
2
Replies
30
Views
5K