Material property comparison based on TDR and delta L

  • Thread starter yefj
  • Start date
4 replies · 1K views · last reply
yefj
Messages
166
Reaction score
2
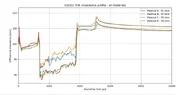
Hello ,As you can see in the plot bellow I have made several TDR of different materials on one plot.
I need to deside which is the best material to use.
Also I know that based on (S21_10inch-S21_5inch)/L I find the loss per inch.
Two questions:
1.after I find the loss per inch how do I find the tan_delta and e_r of the material?
2.looking at this TDR comparison how can I see the best performing material?
Thanks.
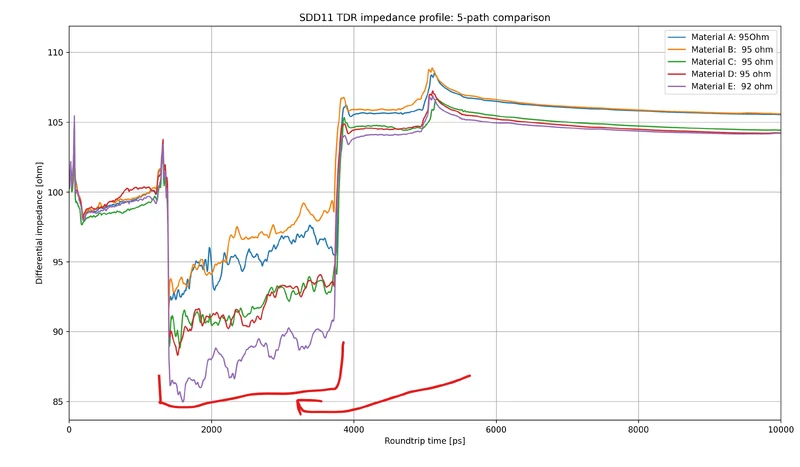
Line plot titled SDD11 TDR impedance profile: 5-path comparison, differential impedance in ohms against roundtrip time in ps, with five coloured traces for Materials A to E and red hand-drawn annotations near the bottom.
 
From the top right corner of your plot, how do you know the impedance of materials A-E? Were they calculated or were they measured using some instrument? You should be able to either, identify the Er was used for their computation, or extract Er from the TDR measurement.

In your case, with a very-long line, the TDR impedance will appear to be Zo = 100Ω. All plots will over longer times, decay exponentially to Zo. In effect, the impedance measurement is being attenuated with the attenuation of the signal. Try to extrapolate lines, (between zero and infinite resistance), with exponential decay towards Zo on the right.

Notice with TDR, that inductance appears to be infinite resistance, while capacitance appears to be zero resistance. I do not see how a TDR plot can give you Tan-d, as the TDR plots the magnitude of the reflected vector, without resolving the separate Z=R+jX components.

TDR is a broad-band plot of impedance against time, not against frequency or phase. To measure Tan-d, (which increases with frequency), you will need to make a two port VNA measurement at a single specified frequency.
 
Hello Baluncore,I know that as the los in bigger then tdr slope is larger.
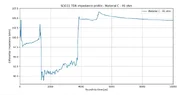
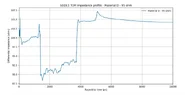
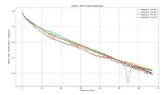
all material TDR is plotted together and loss per inch plot is attached.
what colclution can we get from these plots ?
Thanks.
 
Attachments
  • Line graph titled SDD11 TDR impedance profile - all materials, plotting differential impedance in ohms against roundtrip time in ps for Materials A to D, all rated 95 ohm.
    all_together.webp
    21.6 KB · Views: 21
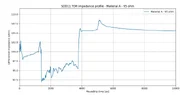
  • Line graph titled SDD11 TDR impedance profile - Material A - 95 ohm, plotting differential impedance in ohm against roundtrip time in ps from 0 to 10000, with impedance mostly between 92 and 108 ohm.
    photo_A.webp
    13.6 KB · Views: 13
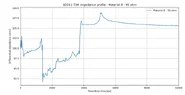
  • Line graph titled SDD11 TDR impedance profile - Material B - 95 ohm, plotting differential impedance in ohm against roundtrip time in ps from 0 to 10000, with the impedance trace rising near 1400 ps and near 3800 ps and settling around 105 ohm.
    photo_B.webp
    14 KB · Views: 25
  • Line graph of SDD11 TDR differential impedance in ohms against roundtrip time in ps, 0 to 10000 ps, for Material C - 95 ohm; the trace sits near 98 to 100 ohm early, drops to about 89 to 92 ohm around 1400 to 3800 ps, then rises to about 105 ohm and settles near 104.5 ohm.
    photo_C.webp
    13.9 KB · Views: 20
  • Line graph titled SDD11 TDR impedance profile - Material D - 95 ohm, plotting differential impedance in ohms against roundtrip time in ps from 0 to 10000, with the impedance trace swinging between about 88 and 107 ohms.
    photo_D.webp
    13.7 KB · Views: 24
  • Line graph titled Delta-L SDD21 loss comparison, plotting SDD21 loss in dB/inch against frequency from 0 to 67 GHz for Material A, B, C and D at 95 ohm; all curves fall steadily, with a sharp dip near 54 GHz on Material C.
    loss_per inch.webp
    19 KB · Views: 23
yefj said:
what colclution can we get from these plots ?
Without context, I can tell nothing.
Baluncore said:
From the top right corner of your plot, how do you know the impedance of materials A-E? Were they calculated or were they measured using some instrument?
 
Hello BalunCore 'The impedance is the impedance of the line.the material i think has the same er but different quality.the line impedance I think was simulated that how the PCB trace width was made.
is there something more which is needed to have a conclution on the plots at previos post?
Thanks.