Material property comparison based on TDR and delta L

  • Thread starter Thread starter yefj
  • Start date Start date
yefj
Messages
110
Reaction score
2
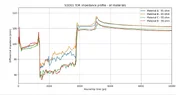
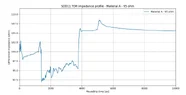
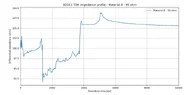
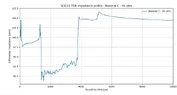
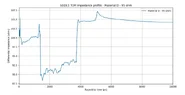
Hello ,As you can see in the plot bellow I have made several TDR of different materials on one plot.
I need to deside which is the best material to use.
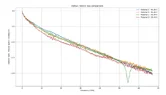
Also I know that based on (S21_10inch-S21_5inch)/L I find the loss per inch.
Two questions:
1.after I find the loss per inch how do I find the tan_delta and e_r of the material?
2.looking at this TDR comparison how can I see the best performing material?
Thanks.


material_comp_up.webp
 
Engineering news on Phys.org
From the top right corner of your plot, how do you know the impedance of materials A-E? Were they calculated or were they measured using some instrument? You should be able to either, identify the Er was used for their computation, or extract Er from the TDR measurement.

In your case, with a very-long line, the TDR impedance will appear to be Zo = 100Ω. All plots will over longer times, decay exponentially to Zo. In effect, the impedance measurement is being attenuated with the attenuation of the signal. Try to extrapolate lines, (between zero and infinite resistance), with exponential decay towards Zo on the right.

Notice with TDR, that inductance appears to be infinite resistance, while capacitance appears to be zero resistance. I do not see how a TDR plot can give you Tan-d, as the TDR plots the magnitude of the reflected vector, without resolving the separate Z=R+jX components.

TDR is a broad-band plot of impedance against time, not against frequency or phase. To measure Tan-d, (which increases with frequency), you will need to make a two port VNA measurement at a single specified frequency.
 
Hello Baluncore,I know that as the los in bigger then tdr slope is larger.
all material TDR is plotted together and loss per inch plot is attached.
what colclution can we get from these plots ?
Thanks.
 

Attachments

  • all_together.webp
    all_together.webp
    21.6 KB · Views: 1
  • photo_A.webp
    photo_A.webp
    13.6 KB · Views: 1
  • photo_B.webp
    photo_B.webp
    14 KB · Views: 1
  • photo_C.webp
    photo_C.webp
    13.9 KB · Views: 1
  • photo_D.webp
    photo_D.webp
    13.7 KB · Views: 1
  • loss_per inch.webp
    loss_per inch.webp
    19 KB · Views: 1
yefj said:
what colclution can we get from these plots ?
Without context, I can tell nothing.
Baluncore said:
From the top right corner of your plot, how do you know the impedance of materials A-E? Were they calculated or were they measured using some instrument?
 

Similar threads

  • · Replies 1 ·
Replies
1
Views
163
  • · Replies 74 ·
3
Replies
74
Views
11K
  • · Replies 15 ·
Replies
15
Views
5K
  • · Replies 16 ·
Replies
16
Views
5K
  • · Replies 27 ·
Replies
27
Views
4K
  • · Replies 1 ·
Replies
1
Views
2K
Replies
1
Views
2K
  • · Replies 1 ·
Replies
1
Views
3K
  • · Replies 2 ·
Replies
2
Views
3K
Replies
3
Views
2K