Multiple linear regression + QQplots problem Includes pics

2 replies · 3K views · last reply
emelie_earl
Messages
3
Reaction score
0
I want to do multiple linear regression, but one of the requirements is the residuals to be normally distributed, and I can check that with QQplots but then the QQ plot shows it is about 95% of data fit into the normal line, but 5% is way off!

can I still proceed ?*or do I have to find a way to transform the data ?*
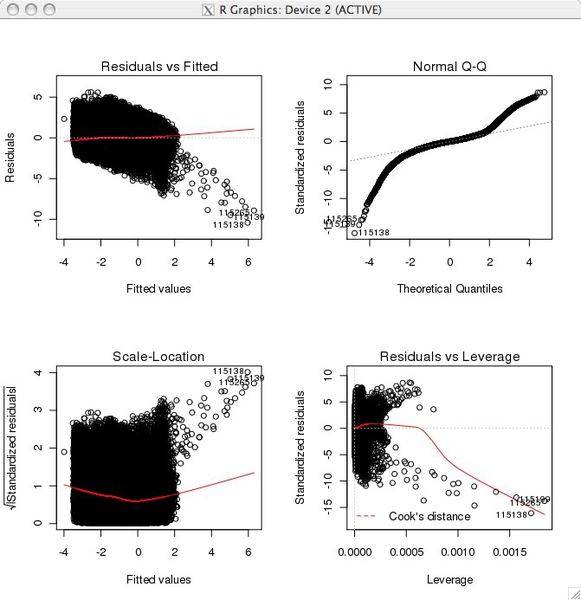

Four-panel R diagnostic plot for a linear regression: Residuals vs Fitted, Normal Q-Q, Scale-Location, and Residuals vs Leverage, with heavy overplotting and a few labelled outlier points.


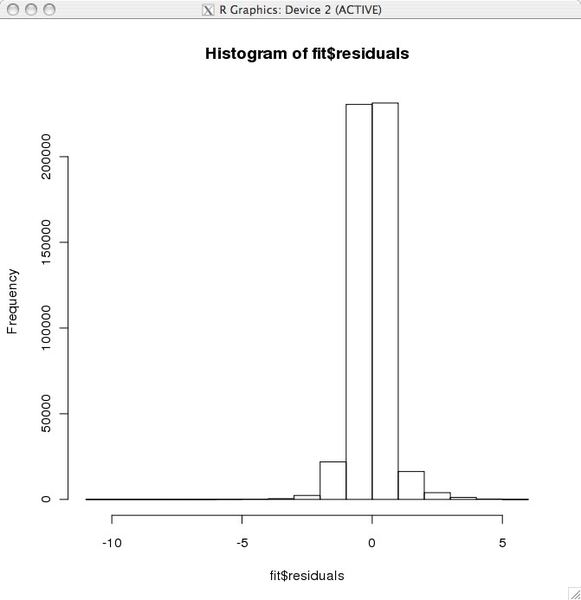
R histogram titled "Histogram of fit$residuals" showing a sharply peaked distribution centred near 0, with very low counts in long thin tails from about -10 to 5 on the x-axis.
 
Your plots show serious non-normality in the error structure, with (as you've noted) problems in the tails, and since least squares is incredibly non-robust you're correct to be concerned.
1) Have you noticed any strange behavior in your estimates (coefficients with signs opposite what you might expect)?
2) Have you tried a robust regression? The MASS package in R provides several good options.
 
statdad said:
Your plots show serious non-normality in the error structure, with (as you've noted) problems in the tails, and since least squares is incredibly non-robust you're correct to be concerned.
1) Have you noticed any strange behavior in your estimates (coefficients with signs opposite what you might expect)?
2) Have you tried a robust regression? The MASS package in R provides several good options.


Thank you!
I will try Robust regression.