Multiple linear regression + QQplots problem Includes pics

Join the discussion
Ask a follow-up here, or get your own question answered by working scientists, mathematicians and engineers — people, not an autocomplete.
Real named experts · corrections over time · the nuance an AI answer skips
2 replies · 3K views
emelie_earl
Messages
3
Reaction score
0
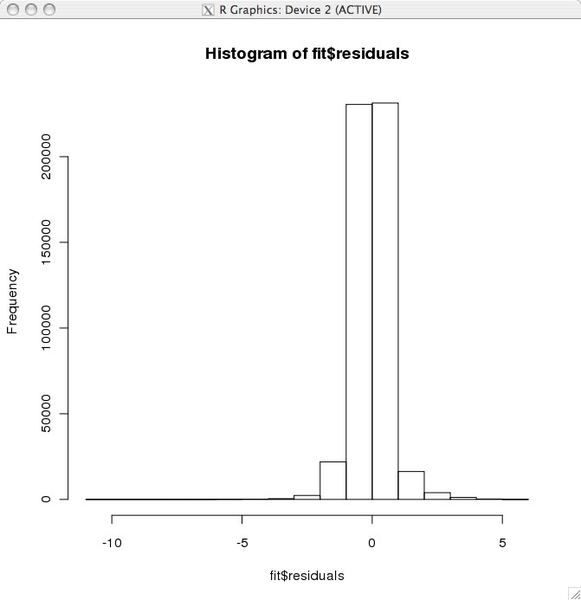
I want to do multiple linear regression, but one of the requirements is the residuals to be normally distributed, and I can check that with QQplots but then the QQ plot shows it is about 95% of data fit into the normal line, but 5% is way off!

can I still proceed ?*or do I have to find a way to transform the data ?*
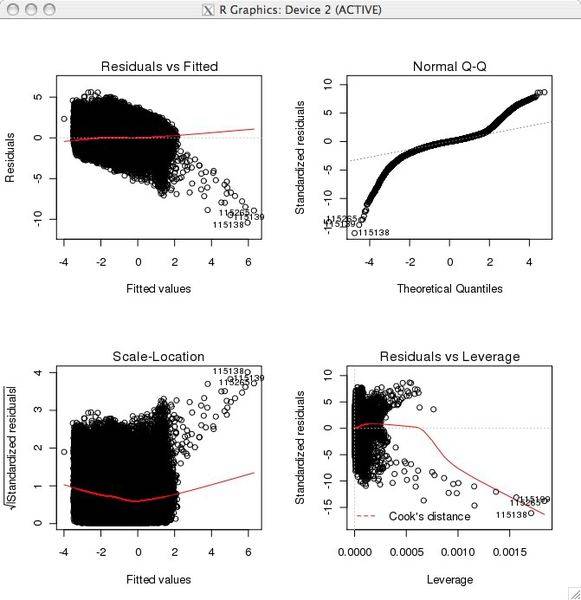

5.jpg


5_residuals.jpg
 
Physics news on Phys.org
Your plots show serious non-normality in the error structure, with (as you've noted) problems in the tails, and since least squares is incredibly non-robust you're correct to be concerned.
1) Have you noticed any strange behavior in your estimates (coefficients with signs opposite what you might expect)?
2) Have you tried a robust regression? The MASS package in R provides several good options.
 
statdad said:
Your plots show serious non-normality in the error structure, with (as you've noted) problems in the tails, and since least squares is incredibly non-robust you're correct to be concerned.
1) Have you noticed any strange behavior in your estimates (coefficients with signs opposite what you might expect)?
2) Have you tried a robust regression? The MASS package in R provides several good options.


Thank you!
I will try Robust regression.