Dustinsfl
- 2,217
- 5
$$
p(r,\theta) = \frac{1}{2\pi}\sum_{n = -\infty}^{\infty}r^{|n|}e^{in\theta} = \frac{1}{2\pi}\left[\frac{1 - r^2}{1 - 2r\cos\theta + r^2}\right].
$$
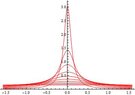
So I produced the graph but it won't animate.
View attachment 378
This code doesn't produce any errors or Mathematica complaining but nothing happens when I hit play.
p(r,\theta) = \frac{1}{2\pi}\sum_{n = -\infty}^{\infty}r^{|n|}e^{in\theta} = \frac{1}{2\pi}\left[\frac{1 - r^2}{1 - 2r\cos\theta + r^2}\right].
$$
So I produced the graph but it won't animate.
Code:
MyR = Table[r, {r, 0, 1, .1}];

u[\[Theta]_] = 1/(2*Pi)*((1 - r^2)/(1 - 2*r*Cos[\[Theta]] + r^2));
Plot[u[MyR, \[Theta]], {\[Theta], -Pi/2, Pi/2},
 PlotRange -> {0, 3.25}, PlotStyle -> {Red}, AspectRatio -> 2/3]
Code:
Animate[Plot[u[\[Theta]], {\[Theta], -Pi/2, Pi/2},
  PlotRange -> {0, 3.25}, GridLines -> Automatic, Frame -> True,
  PlotStyle -> {Thick, Red}], {r, 0, 1, 0.1},
AnimationRunning -> False]Attachments
Last edited: