Peak detection using MATLAB (signal processing)

Join the discussion
Ask a follow-up here, or get your own question answered by working scientists, mathematicians and engineers — people, not an autocomplete.
Real named experts · corrections over time · the nuance an AI answer skips
16 replies · 92K views
kay310
Messages
8
Reaction score
0
I'm doing signal processing using MATLAB.

But facing problem when doing Peak Detection.


This is the signal that I used for the processing:
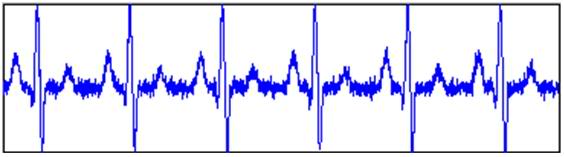
sample1.jpg


This is what i wish to do:
a) the horizontal line is the threshold point and
b) the circle is the peak detection
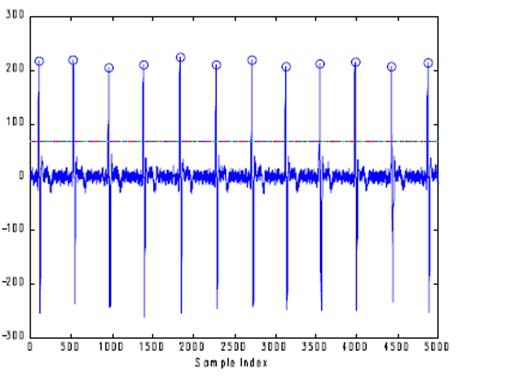
sample.jpg


Can anyone help me in this?
1) set a threshold point for the signal
2) detect the peak
 
on Phys.org
ECG?

If x is your signal, you get logical indices for which x is above the threshold simply by
x > threshold;
Eg, x = [1 3 1 4],
x > 2 returns [0 1 0 1], (and x(x > 2) returns [3 4]).

What you should consider is that there might be a couple of successive samples above the threshold. If this is the case, I'd probably do something along the lines of x > threshold, diff, and find the positive values (if for some reason the maximum value above the threshold is important, you'd have to max as well).

I think this came out a bit convoluted, but I tried avoiding completely solving the problem for you.
 
I'm actually can't really understand what you means.
Would you mind to explain more to me?
 
Well, if x is your ECG, (or whatever signal),
you can threshold with
x > threshold;
Now, this is a vector with zeros and ones.
At ones, the signal is above the threshold.
Do e.g.
ind = x > threshold;
plot(1:length(x), x, find(ind), x(ind), 'o')

This will probably be rather close to the desired output, but if there are successive values of x above the threshold, this won't come out right. You would have to determine the maximum of these successive values. I'd use the diff-command to differentiate as that ought to be quite simple to implement, but you may have other preferences.
 
Thanks for help.
But,
what is the 'successive values' means?
 
By successive I meant that two values of the signal in a row exceed the threshold value.

E.g.
x = [1 1 1 1 3 4 1 1 1 1], if the threshold is 2, the algorithm is going to tell you there are two peaks, where in reality there is only one.
 
oh I get it already.
Thanks for your help. Thanks so much.
 
i need MATLAB program of peakdetect program pl help me
 
If I have successive values, how should I go about doing that?
 
hey i also need some help regarding ecg signal..i need to make an algorithm in MATLAB to find values of r-peaks...so that if i want to have a value of any r-peak i can get it from this algorithm like pan-tomkins algorithm in matlab.can anyone help for it?
 
Päällikkö said:
By successive I meant that two values of the signal in a row exceed the threshold value.

E.g.
x = [1 1 1 1 3 4 1 1 1 1], if the threshold is 2, the algorithm is going to tell you there are two peaks, where in reality there is only one.

Hi, I'm also facing same problem, I'm doing a heart signal peak detection project and i attached the plot result , can u tell me how i solve this ?

Thanks
 

Attachments

  • untitled.jpg
    untitled.jpg
    12.9 KB · Views: 1,418
satinysol said:
Hi, I'm also facing same problem, I'm doing a heart signal peak detection project and i attached the plot result , can u tell me how i solve this ?

Thanks

Given the above example: x = [1 1 1 1 3 4 1 1 1 1]

peakfinder (http://www.mathworks.com/matlabcentral/fileexchange/25500) gives you the following:

[peak loc] = findpeaks(x)

peak = 4 <-- the amplitude of the peak is 4
loc = 6 <-- the location of the peak is 6

there are also lots of other useful functions included in the package.
 
alletsefinn said:
Given the above example: x = [1 1 1 1 3 4 1 1 1 1]

peakfinder (http://www.mathworks.com/matlabcentral/fileexchange/25500) gives you the following:

[peak loc] = findpeaks(x)

peak = 4 <-- the amplitude of the peak is 4
loc = 6 <-- the location of the peak is 6

there are also lots of other useful functions included in the package.

Can tell me how to proceed this code? I'm really new for this ,thanks
 
satinysol said:
Can tell me how to proceed this code? I'm really new for this ,thanks

Setting up peakfinder
1. download the peakfinder package from the link above. extract/unzip the folder and put it in a folder under your MATLAB path
2. in matlab, add the peakfinder folder to path (file -> set path, click on set path, select the peakfinder folder by browsing, click on save, then click on close)

Using peak finder
assuming your signal is already in the MATLAB workspace called x, to find the peaks using peakfinder, type in the following in the MATLAB command window:

[peaks, locs] = findpeaks(x)

this would result in two vectors:

peaks = [# # # # # ... ] <-- indicates all the peaks that are found in x
locs = [# # # # # ...] <-- indicates all the locations/positions of the found peaks

to examine the peaks found using this setting, you can type in the following:

plot(x);
hold on;
plot(locs,peaks,'o','MarkerEdgeColor','r')

more functions/setting can be consulted through typing 'help peakfinder' in the MATLAB command window. hope this helps.
 
alletsefinn said:
Setting up peakfinder
1. download the peakfinder package from the link above. extract/unzip the folder and put it in a folder under your MATLAB path
2. in matlab, add the peakfinder folder to path (file -> set path, click on set path, select the peakfinder folder by browsing, click on save, then click on close)

Using peak finder
assuming your signal is already in the MATLAB workspace called x, to find the peaks using peakfinder, type in the following in the MATLAB command window:

[peaks, locs] = findpeaks(x)

this would result in two vectors:

peaks = [# # # # # ... ] <-- indicates all the peaks that are found in x
locs = [# # # # # ...] <-- indicates all the locations/positions of the found peaks

to examine the peaks found using this setting, you can type in the following:

plot(x);
hold on;
plot(locs,peaks,'o','MarkerEdgeColor','r')

more functions/setting can be consulted through typing 'help peakfinder' in the MATLAB command window. hope this helps.

This is very helpful ,thank you so much ^^
 
alletsefinn said:
Setting up peakfinder
1. download the peakfinder package from the link above. extract/unzip the folder and put it in a folder under your MATLAB path
2. in matlab, add the peakfinder folder to path (file -> set path, click on set path, select the peakfinder folder by browsing, click on save, then click on close)

Using peak finder
assuming your signal is already in the MATLAB workspace called x, to find the peaks using peakfinder, type in the following in the MATLAB command window:

[peaks, locs] = findpeaks(x)

this would result in two vectors:

peaks = [# # # # # ... ] <-- indicates all the peaks that are found in x
locs = [# # # # # ...] <-- indicates all the locations/positions of the found peaks

to examine the peaks found using this setting, you can type in the following:

plot(x);
hold on;
plot(locs,peaks,'o','MarkerEdgeColor','r')

more functions/setting can be consulted through typing 'help peakfinder' in the MATLAB command window. hope this helps.

I'm not sure if i should leave this message here,but I'm doing it, here's my problem,like u said i tried with the code ,it was very nice and very useful,it doing well when i input the data under 1200sampling frequency,but when i tried other data under different sampling frequency the result was not satisfactory, here i attached something related to my issue
 

Attachments

  • result under 256sampling frequency.jpg
    result under 256sampling frequency.jpg
    19.7 KB · Views: 1,560