leprofece
- 239
- 0
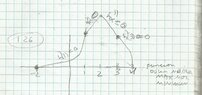
Plot a continue function graph with the following data o properties f(4)= 0 f of (-2) = 0 f of second derivative in 1 = 0?
f of first derivative in (3) = 0
f de second derivative in 2 =0
2nd derivative (x) > 0 and (1,2)
2nd derivative (x) < 0 in x < 1 and x>2
see my graph is it correct?? where am I wrong??
I got confused because secon and first derivative descipcion in 3 does not match with the data given View attachment 2728m