Plotting a Function in Gnuplot with Range: 0<z<3, -5<x<5, -5<y<5

  • Thread starter Thread starter Pessoa
  • Start date Start date
  • Tags Tags
    Gnuplot Plotting
Join the discussion
Registration is free. Ask a follow-up in this thread, or start your own.
2 replies · 3K views
Pessoa
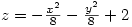
I want to plot in gnuplot the function , with the range being:
c06a7dd2d438f9fbfc5e2fd7b939cd73.gif


0<z<3
-5<x<5
-5<y<5

What is the command?

Thanks in advance, fellows.
 
Physics news on Phys.org
I think it is the set range command. I'm not sure of the syntax, but it's something like set xrange [-5:5]. You might want to check that in the help file.
 
Last edited:
set xrange[-5:5]
set yrange[-5:5]
set zrange[0:3]
splot -x*x/8.0 - y*y/8.0 + 2