Robin04
- 259
- 16
I'm trying to plot the solution to an ODE (with given initial values) but there are some constants in it that I want to evaluate with sliders and I'm not sure what is the right syntax for this.
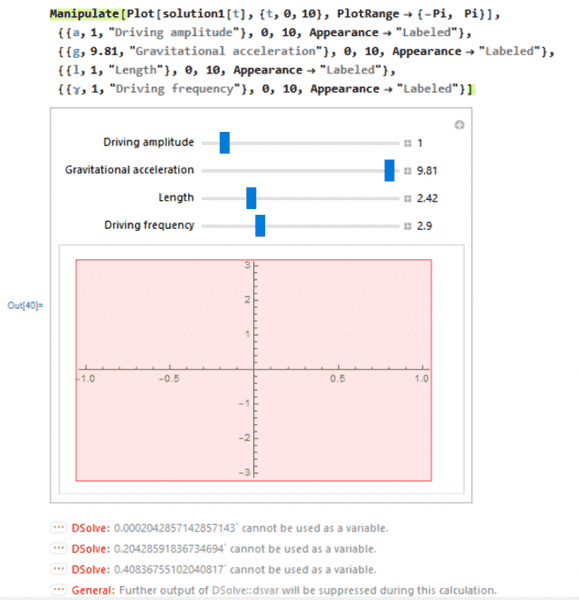

If I copy solution1 explicitly into plot it works, but if I refer to it by the variable name it doesn't. What's the correct syntax for this?
Code:
Manipulate[Plot[solution1[t], {t, 0, 10}, PlotRange -> {-Pi, Pi}],
{{a, 1, "Driving amplitude"}, 0, 10, Appearance -> "Labeled"},
{{g, 9.81, "Gravitational acceleration"}, 0, 10,
  Appearance -> "Labeled"},
{{l, 1, "Length"}, 0, 10, Appearance -> "Labeled"},
{{\[Gamma], 1, "Driving frequency"}, 0, 10, Appearance -> "Labeled"}]
If I copy solution1 explicitly into plot it works, but if I refer to it by the variable name it doesn't. What's the correct syntax for this?
Attachments

