Properly producing TDR on PNA network analyzer N5224B

  • Thread starter Thread starter yefj
  • Start date Start date
yefj
Messages
78
Reaction score
2
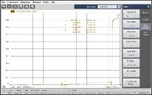
Hello, my pna port1 is connected to a resonator.
the resonator is connected to pna threw a good line 30cm long.
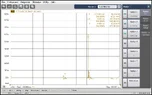
I made S11 of 10Mhz to 40Ghz and converted to time domain(probably pna doing ifft) as you can see in the photos.
the time resopnce is very bad.
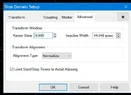
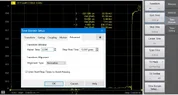
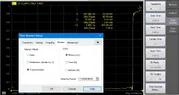
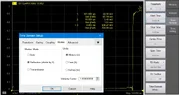
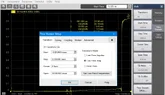
There is a menu I have to the time domain shownin the photo.
What setting could make my TDR better looking so I could see the reflections from the load of port 1 ?

Capture2.webp


time domain window_s11 (1).webp
 
Last edited by a moderator:
Engineering news on Phys.org
If you are measuring S11, why are connecting another coax cable to the 2nd VNA port? For S11 you should only need one connection to the resonator. You can just terminate the output of the resonator in a 50 Ohm coax terminator.

What frequency is the resonator tuned to? Can you show S11 in the frequency domain for reference? How does that measurement change if you connect the resonator directly to Port 1 of the VNA with just a coax adapter instead of through a 30cm coax cable?

(Very nice instrument, BTW.) :smile:
 
yefj said:
What setting could make my TDR better looking so I could see the reflections from the load of port 1 ?
Since it is computing the time domain from the frequency domain, it might have 'automatic fixture removal' software running that will remove the connection cables from the frequency domain network analysis. That would remove the cables from your computed TDR.
 
Hello , lets take a simpler case, I have an open on the end of the cable so reflection is -1.
so the reflected signal cacels the original one after a round trip. T(2*L/V)
I expect the see a TDR ash shoqwn below.
but in reality ash you can see in the TDR I got its totally different.
also I attached the original S11.
Where did I go wrong?
Thanks.

1776941426183.webp

1776941604869.webp

1776941841000.webp

1776941858881.webp

1776941878419.webp

1776941947133.webp

1776941994969.webp
 
You are plotting with a dB Log vertical axis in time mode. Try plotting with a linear vertical scale like in a TDR, the noise floor grass should disappear.

In the time domain plot, the decaying oscillations at +0ns and at +4ns suggest a BP filter is corrupting the low-frequency DC signal, while hiding the high-frequency TDR step.

A TDR employs a fast rise DC pulse, while S-parameter analysis employs AC coupling. The filter should be turned off.

Is there any documentation on how to set up the PNA to do a TDR?
 
hello balun core_I have attached the tdr in linear scale few questions:
1.what is meaning of the y axes?
for example marker 2 of the photo we have is 4.22ns and yaxes 567mu
what is "mu"?
2. I saw in other manuals the keiser coeffient shownin the photos.What theoretically is the best way to get TDR as clear as possible?
Also the Help manual is attached.
Thanks.
 

Attachments

  • tdr_linear.webp
    tdr_linear.webp
    29.3 KB · Views: 1
  • time_gating_setup.pdf
    time_gating_setup.pdf
    732.9 KB · Views: 1
  • kaiser_beta_setup.webp
    kaiser_beta_setup.webp
    18.3 KB · Views: 1
Help manual, page 7, see the green plot examples.
Experiment with different transform modes.
It seems you were using an "Impulse Mode".
You need to use "Low-pass Step Mode" to see the transmission lines.

On the Keysight N5224B PNA Microwave Network Analyzer, mU stands for milli-Units, representing a linear magnitude value multiplied by 10-3. It is a unit often used in linear magnitude formats for S-parameters, where the values are small.
 
Hello Baluncore,few questions:
1.why making pulse rise time shorter make tdr better?
2.I have transformed into time domain step responce.Is it more logical now given that port 1 cable has nothing connected to it?
3.I have shown in the photos below the Y-axes settings and how the markers look at each settings
Where can I see the impedance value? is there a way I could see it?
Thanks.
 

Attachments

  • new_time_domain_plot.webp
    new_time_domain_plot.webp
    30.6 KB · Views: 1
  • new_time_setting_1.webp
    new_time_setting_1.webp
    33.3 KB · Views: 1
  • new_units_reflection.webp
    new_units_reflection.webp
    28.7 KB · Views: 1
  • new_units_transmition.webp
    new_units_transmition.webp
    27.8 KB · Views: 1
  • new_pulse rise_time.webp
    new_pulse rise_time.webp
    29.1 KB · Views: 1
yefj said:
1.why making pulse rise time shorter make tdr better?
It improves the spatial resolution of the reflected features. The spatial resolution is on the order of the rise time. If you want to see ##Z_0## discontinuities that are, say, 1cm in extent, you will need a TDR pulse risetime which corresponds to that length in the medium.
 
  • #10
yefj said:
1.why making pulse rise time shorter make tdr better?
https://en.wikipedia.org/wiki/Gibbs_phenomenon#Description
If the rise-time of the step is only 1ns then you can only see big or long discontinuities in the impedance of the line.
As the rise-time becomes shorter, the bandwidth becomes greater, and the linear resolution is improved.
yefj said:
2.I have transformed into time domain step responce.Is it more logical now given that port 1 cable has nothing connected to it?
Terminate the port 1 cable with a resistive mismatched.
yefj said:
Where can I see the impedance value? is there a way I could see it?
The voltage, maps to reflection coefficient, ρ (rho), then to impedance relative to Zo. The vertical axis range is from:
1.0V, with ρ = +1, infinite ohms.
0.5V, with ρ = 0, at Zo.
0.0V, with ρ = -1, at zero ohms.

Zline = Zo * (1+ρ) / (1-ρ)
 

Similar threads

  • · Replies 17 ·
Replies
17
Views
1K
  • · Replies 6 ·
Replies
6
Views
8K
  • · Replies 2 ·
Replies
2
Views
2K